Introduction
Since Season 7, we can already see a shift from expansion to refinement. Season 7 introduced new governance bodies and experiments, focusing on building a DAO that can operate reliably over time. Rather than adding complexity, the path the Collective is taking is to simplify and strengthen operations to ensure long-term accountability (a direction that continues and becomes more pronounced in the current Season 8). This shift is particularly noticeable with the impact of optimistic approvals that first emerged in Season 7 and continue today. In this report, we break down the Top 100 delegates’ participation and trace how it evolved compared to previous seasons.
Autors: @Elipancake, mrwildcat and @delphine among the SEEDGov team.
We would like to acknowledge @lavande for her feedback and suggestions.
Season 7
TL;DR:
- Grants council had a 40% reduction vs previous season, in line with the narrower scope.
- Milestones & Metrics became an independent Council.
- First elections for Security Council Cohort A with its budget was published for the first time after its funding moved from Foundation to the Governance Fund.
- Code of Conduct Council was disolved after Token House approval.
- Minimalism = hyperfocus: fewer people holding more seats, the DAO is leaner but more professional.
- Participation held up: 49/100 delegates voted on average (+6.8% vs S6). Optimistic Approvals didn’t lower turnout as many might expected.
- Costs went +38% up, but not from bureaucracy: More specialized roles, more reporting.
- Budgets more spread out: no longer all about the Grants Council (79% in S6), now also M&M, DAB, and the Security Council.
- Transparency leveling up: S7 was the first step; S8 brings the Budget Board and Open Source Observer reports to measure impact.
- S7 had -22% fewer rationales and -25% feedback than S6. Voting happens, discussion less so.
Token House Total Number of Participants
The data indicate that the collective’s overall structure has remained relatively consistent compared to last season. Season 6 brought together 45 distinct individuals across the main governance bodies, a number that climbed to 62 when we factor in ACC participation. Season 7 presented an interesting paradox: while there were 42 seats across the Grants Council, Security Council, DAB, the newly-formed Milestones & Metrics Council, and govNERDs, only 40 unique participants filled these roles. This 95% seat-to-participant ratio reveals how the collective might operate: a preference for drawing from a trusted pool of experienced contributors rather than expanding the participant base. When ACC participation is included, total unique participants reach 64, representing a 3.2% increase from the previous season.
S7 Member Allocation
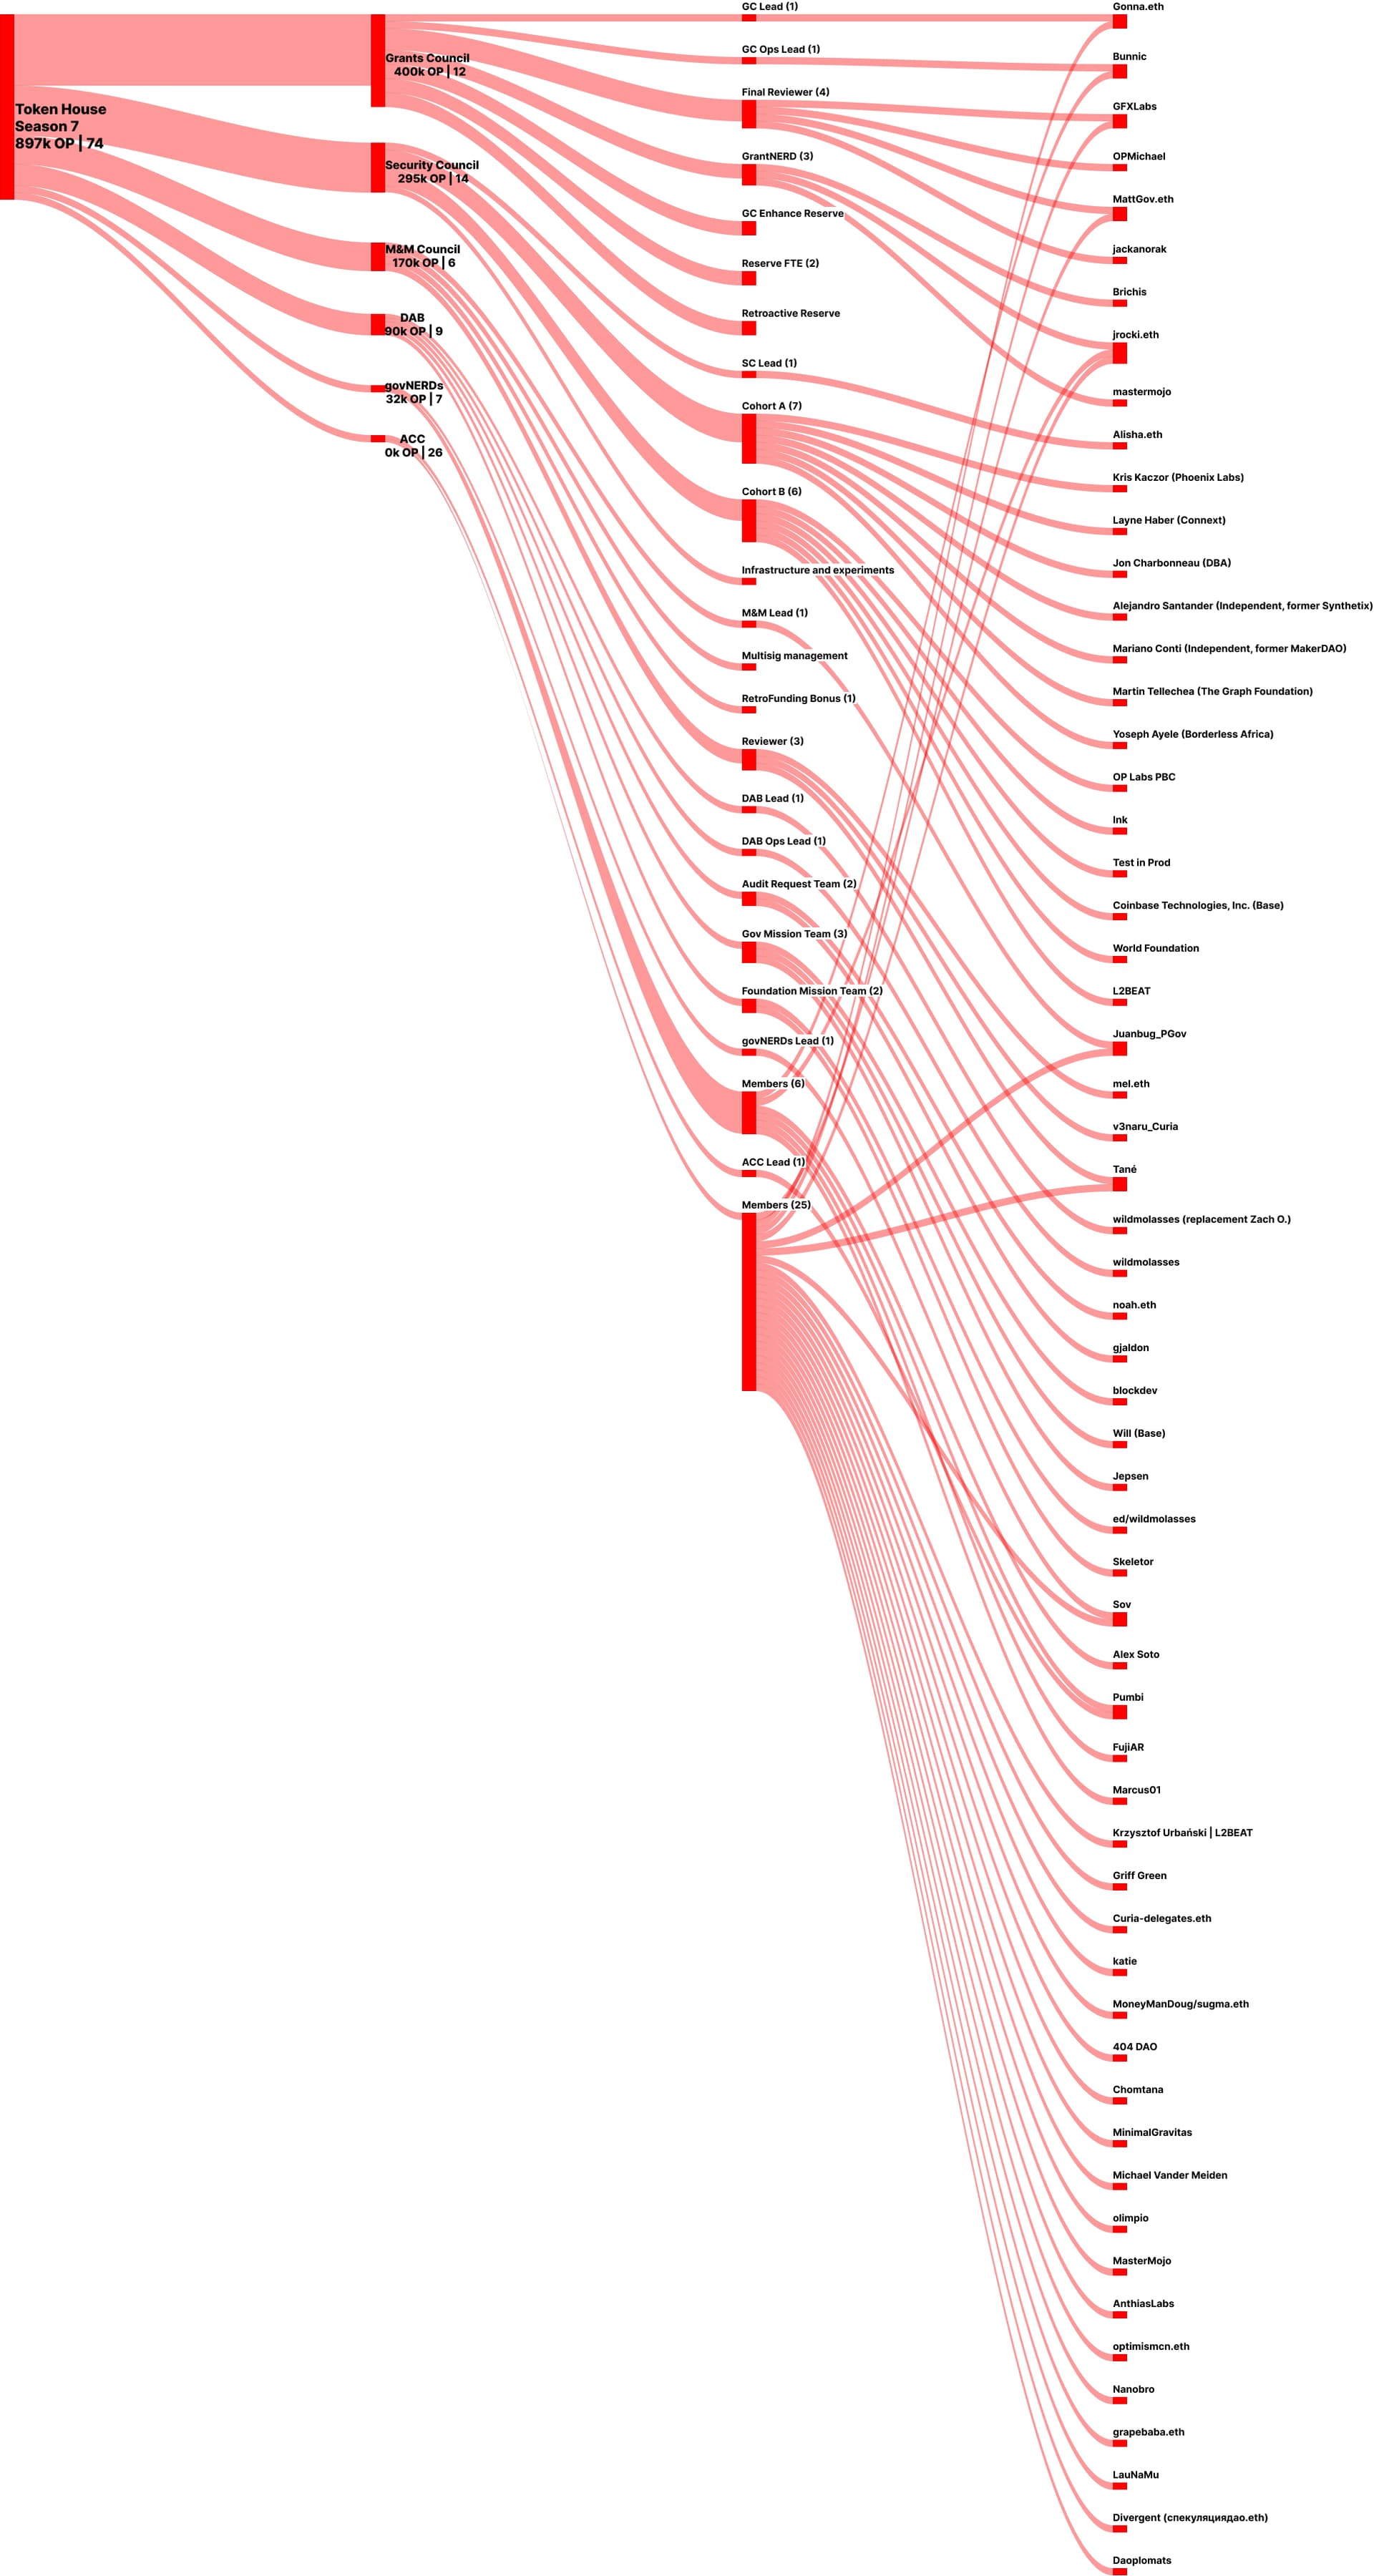
Figure 1: Seat distribution across Token House governance bodies and quantifies instances of multi-role participation among individual members.
Season 7 Operating Costs
From the sum of approved budgets for councils and boards, we can deduce that the collective’s operating costs for governance amount to 1,055k OP, which is 38% higher compared to the 762k OP from Season 6. Figure 2 below is a sankey diagram breaking down how these costs were structured.

Figure 2: Season 7 Operating Costs.
- 400k OP - Grants Council Operating Budget (Season 8 Proposal)
This marks a 34,4% decrease from S6 610k OP and might be attributed to a narrower scope: the Milestones and Metrics Council was wet as an independent entity, the Superchain Subcommittee has been sunset and audit reviews are handled by the Developer Advisory Board. S7 Grants Council was focused solely on delivering high-impact grants aligned with TVL growth metrics.
This can also be attributed to the fact that between Season 6 and 7, the Grants Council reduced its size by over 50% (from 15 to 7 reviewers) in line with the long-term vision outlined in its charter. This was a strategic redesign where the council shifted from a format-based structure to one focused on TVL growth. The council simplified its operations by eliminating possible bureaucracy and passing responsibilities to other bodies, like the M&M Council.
- 170k OP - Milestones and Metrics Council Operating Budget
As mentioned, the council was formalized as a separate entity from the Grants Council, keeping a budget consistent with the previous allocation, where the 3 milestones reviewers received 25k OP each.
- 190k OP - Developer Advisory Board (DAB) Operating Budget
Compared to the 90k OP from the previous season, this budget represents a +47% increase, with role restructurings that eliminated the Upgrade Czar position and added the Mission Scouts, while the OP Labs Representative role remained unchanged as an unpaid position. Increase in Lead payment by +20%, Ops Lead got a smaller stipend, members got split into specialized teams at 12.5k each, and new roles were set: Foundation Mission Team and Mission Scouts. The council grew to 9 members, adding 2 more compared to its predecessor.
- 295k OP - Security Council Operating Budget
First time the council’s budget was made public and approved by the Token House, as it was transferred from Foundation expenses to being supported by the Governance Fund.
The Anti-Capture Commission has no operating budget, but active delegate participation may count toward Retro Governance rewards (50%+ voting).
Meanwhile, Optimism Foundation covered the following costs:
- Core govNERDs
- 10,000 OP for Season 7 and 2,857 OP for Reflection Period - govNERD Lead
- 3214 OP per member (2500 OP for Season 7 and 714 OP for the Reflection Period per govNERD)
Other changes: Code of Conduct Council (CoCC)
The council was formally dissolved prior to Season 7 through a Foundation proposal with no longer Budget allocated to this effort. The Foundation initiated the process as the CoCC was not longer aligned with the Collective’s governance-minimized approach. The proposal was approved by Token House in special voting cycle #31a.
Operational Budgets Evolution
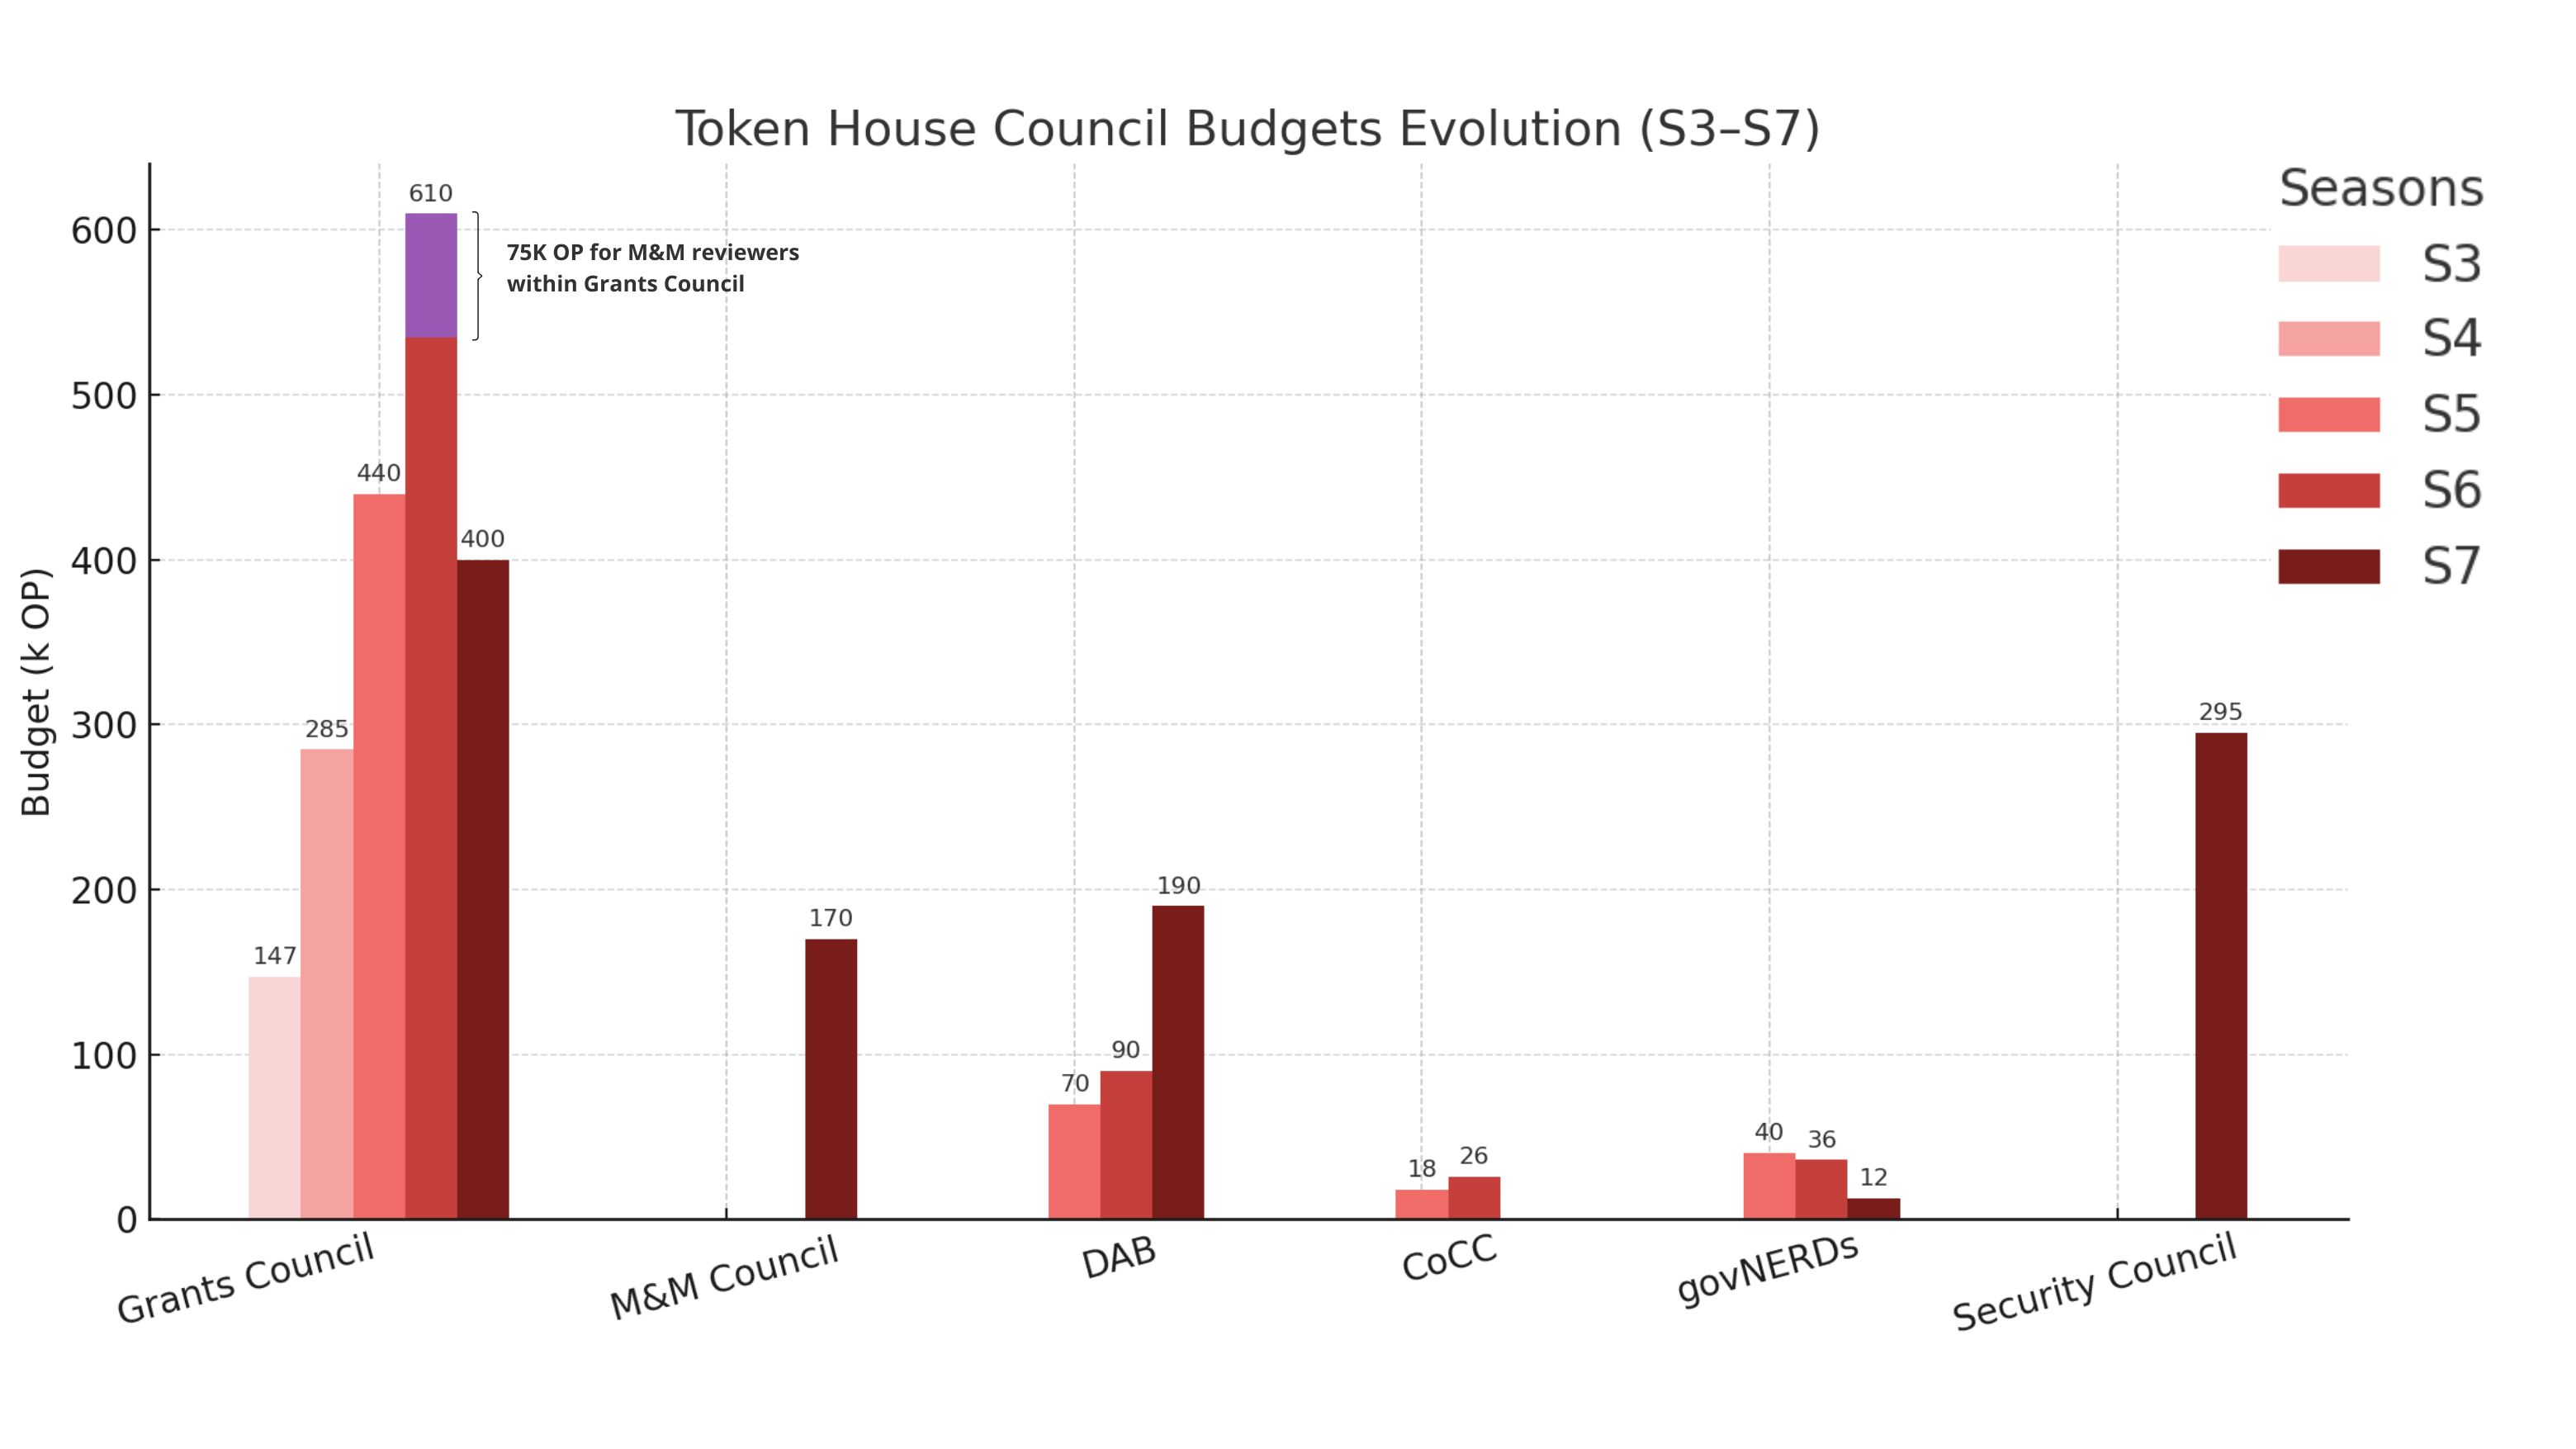
Figure 3: Token House Budget Evolution (S3-S7)
Note: The purple section at the top of the Season 6 Grants Council budget represents the amount allocated to Milestones & Metrics reviewers, as they were still part of the Grants Council at that time. In Season 7, this group became independent, keeping its three-reviewer structure and adding a lead role.
Figure 3 shows that Season 6 marked a clear peak where the budget was largely concentrated in the Grants Council (79% of the Token House budget was allocated to this council). The S7 Grants Council’s budget (400k OP) grew 172% compared to Season 3, but it’s worth pointing out that it’s still 34% lower than 610k OP in Season 6. But if we include the 170k OP allocated to the newly independent M&M Council, the combined amount is 570k OP, only 7% below S6 budget.

Figure 4: Token House Council Budgets
Figure 4, in contrast, shows the evolution of council budgets using 100% stacked bars. Each bar represents the season’s total budget as 100%, showing the relative share of each council. This makes clear how the Grants Council’s share fell sharply in S7 as M&M and Security Councils appeared, DAB grew, and govNERDs and CoCC became much smaller parts of the mix.
Season 7 shows different budget allocation patterns. The creation of new governance bodies like the Milestones & Metrics Council shifted how resources flow through the ecosystem, which is reflected in more targeted funding streams rather than the broader approach we saw previously. This restructuring meant total governance spending increased during S7, though this jump was expected, since for the first time the Security Council’s operational costs became part of the public budget. This is something we celebrate as it means adding transparency to what had been less visible expenses in previous seasons. Beyond accounting changes, the introduction of councils like M&M reflects something deeper: the Token House is evolving toward specialization, with dedicated bodies handling specific functions, seeking to distribute tasks without overloading responsibilities on any single body.
One reading could be indicating that this shift suggests institutional maturity. We’re seeing more rigorous processes and systematic impact measurement, which is a sign that governance is becoming less experimental and more systematic. We’re getting a bit ahead of our conclusions, but the challenge now is maintaining this professional approach while keeping the overall structure lean enough to remain efficient and accessible.
S7 Intent Budget
Budget Distribution
Token House approved a 9.5M OP budget for one single Intent: Deliver Interoperable Stage 1 Chains on the Superchain.
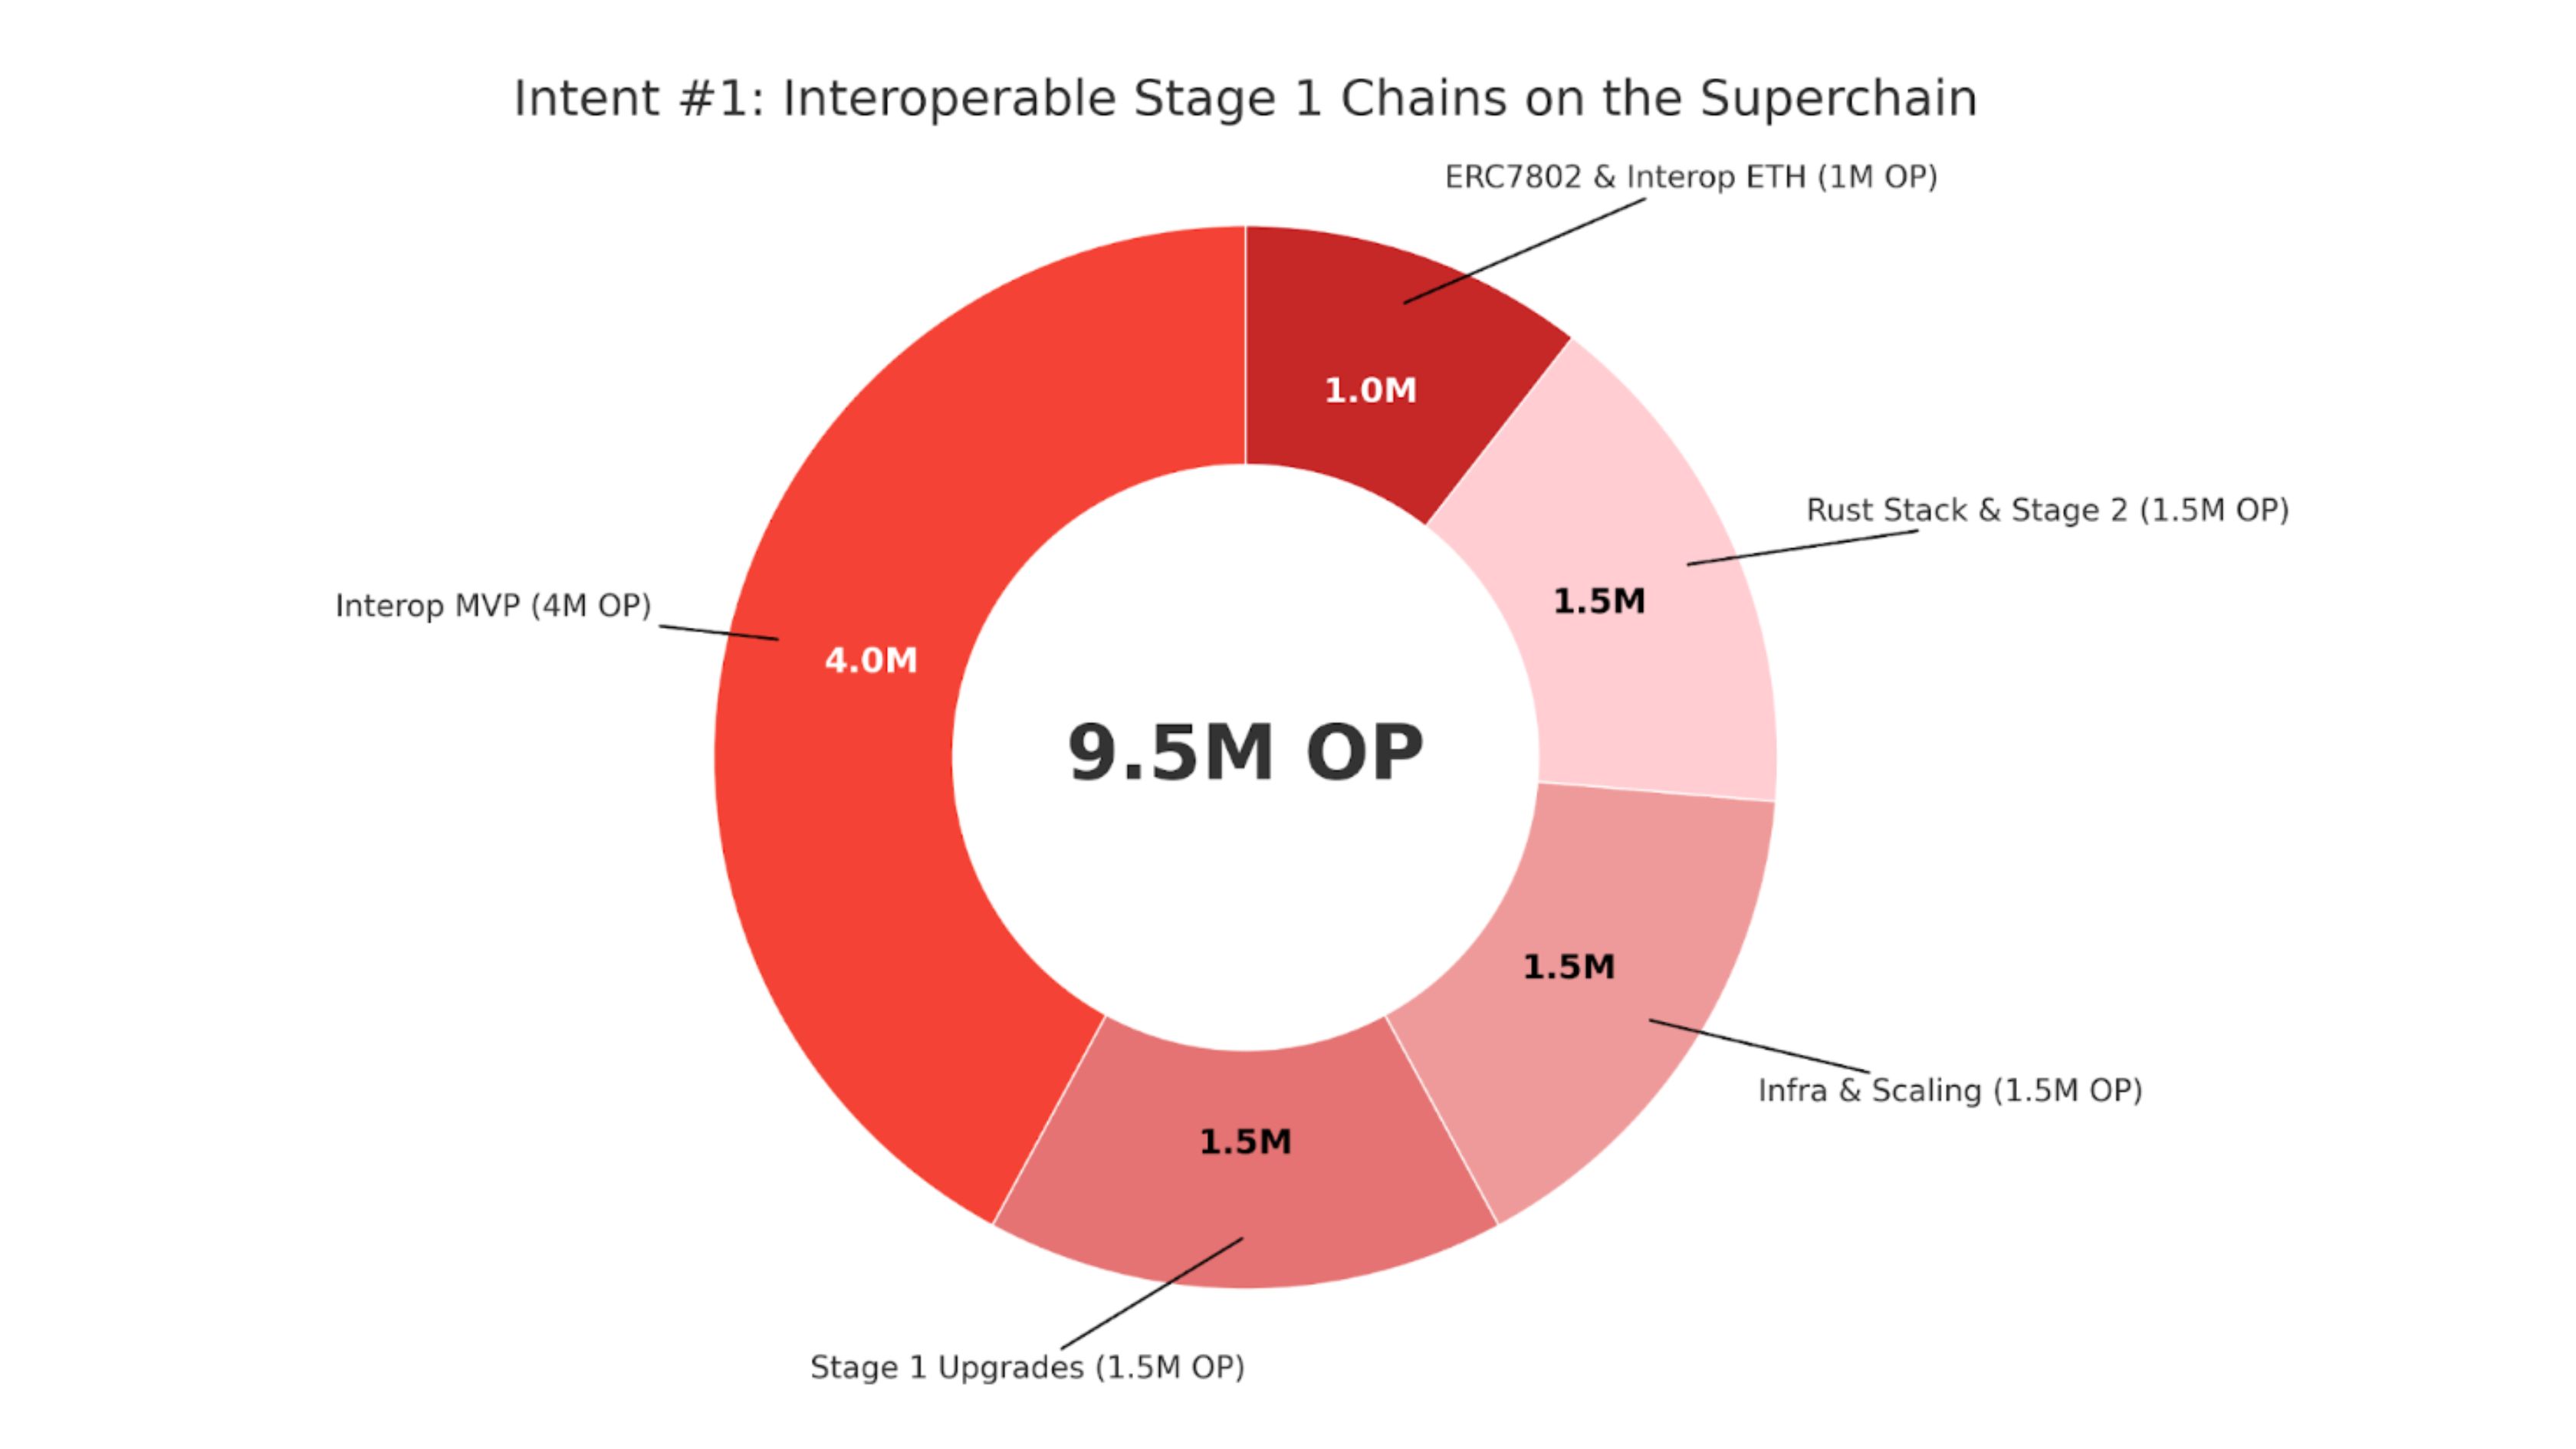
Figure 5. Season 7 Intent Budget
Season 7 implemented a -51% budget reduction which went from 19.5M OP to 9.5M OP. In Season 6, approximately 92% of funds supported developer grants and application growth across the Superchain. On the other hand, Season 7 took a new approach: a unified intent directing all OP allocation toward technical infrastructure (a focus that still continues in Season 8). The Interop MVP received the largest portion at 42% (4M OP), while remaining resources were distributed more evenly: 15.8% each for Stage 1 Upgrades, Scaling Infrastructure, and the Alternate Rust Stack with Stage 2 progress, plus 10.5% for ERC7802 adoption and interoperable ETH.
It can be inferred that the shift toward a single intent, accompanied by a consequent logical -51% budget cut, may reflect a more mature and hyperfocused approach to resource distribution. A single intent instead of distributing funds among various developer grants like in Season 6, this narrower strategy suggests that the collective aims to do more with less. In more traditional environments, when organizations focus their efforts this way they sometimes discover that specialized teams can achieve better results when objectives are clearer. The iteration from supporting numerous exploratory projects to funding one comprehensive intent for technical infrastructure in Season 7 obviously simplifies measuring real impact. This change could be indicating that the collective is moving beyond its initial experimental phase (if we ever stop experimenting?) toward more results-oriented budgets.
Season 7 Participation and Voting Data
Disclaimer
To conduct this participation analysis, we relied on the Delegate Expectations Framework and pulled data from the forum and Agora. In cases where delegates left rationales or feedback outside of these two platforms, it wasn’t possible to track and therefore count them, so they won’t be reflected in the numbers. If any data is missing, please let us know and we’ll add it.
Data Collection and Methodology
A quantitative approach was set, and the dataset was pulled from Agora and the Optimism Governance Forum. The aim was to quantify governance participation and engagement by looking at voting patterns, rationales and feedback. Below is outlined how we extracted and classified the data.
Voting Data Extraction
Votes were collected from Agora, focusing on the top 100 delegates as of a snapshot taken from Curia dashboard on 2025-01-16. The study defines voting interactions as follows:
- Vote Classification: Each vote (For, Against, or Abstain) is counted as a single interaction.
- Non-Participation: Delegates who did not vote or were not part of the top 100 at the time of data extraction are excluded from the dataset.
- Metric Representation: A single column labeled 1 Vote indicates whether a delegate participated in the vote, independent of the vote’s nature.
Rationale Analysis
The justifications accompanying votes were extracted from Agora. These entries are essential for understanding the decision-making processes of delegates. Rationales were categorized as follows:
- Linked Rationales: Some rationales include direct links to the delegate’s thread or forum posts, offering additional context of their reasoning.
- Unlinked Rationales: Other delegates provide explanations within Agora itself without external links. These are equally considered rationales if they provide the reasoning behind their vote.
- Exclusion Criteria: Rationales that merely reiterate the vote (e.g., a simple statement of “voted For” without further explanation) were excluded from the dataset. Any explanation that extends beyond this minimal clarification was classified as a rationale.
Example: If Delegate Y states, “I voted For this proposal,” without elaborating further, it is not counted in the dataset, as it lacks context (aka. Exclusion Criteria). However, if Delegate Z explains, “I voted For because it aligns with xyz,” or “I vote For with this link with the reasoning behind the decision” it is counted as 1 in the database (aka. Linked/Unlinked Rationales).
Feedback Analysis
Feedback refers to delegate engagement on the Forum. For this metric, we considered any forum comments related to a specific proposal. This includes:
- Comment Types: Questions, suggestions, critiques, or enthusiastic endorsements. The nature or sentiment of the feedback was not qualitatively assessed, as the focus of this study remains quantitative.
- Interaction Count: Each delegate’s feedback, regardless of the number of individual comments, is counted as 1 single interaction per proposal.
Example: Delegate A posted two different entrance posts in a proposal thread, and Delegate B posted just once. Both are recorded as providing “1” Feedback interaction.
By adopting this standardized methodology, this analysis seeks to understand participation in a more comprehensive way, regardless of each delegate’s individual activity. This allows us to have a broader view of delegate participation patterns. Of course, this isn’t the only or necessarily the best way to approach this topic, as this quantitative approach doesn’t measure the quality or impact of feedback but rather reduces it to numerical data, but it’s the approach chosen to focus on the bigger picture of governance engagement.
Methodological Limitations
There are several methodological constraints that should be considered when interpreting results:
-
Data Scope: The analysis captures feedback exclusively from Agora/forum interactions. Other platform communications and informal governance discussions are not reflected in these metrics.
-
Participant Classification: Certain roles, such as govNERDs, are included in delegate participation metrics, though their forum engagement may reflect institutional responsibilities rather than standard delegate behavior patterns. Also Foundation and OP Labs personnel are excluded from delegate participation calculations, since the focus is Top 100 delegates.
-
Engagement Measurement: For multi-component proposals such as Mission Requests, engagement is measured at the proposal level rather than by individual post interactions, prioritizing breadth of participation over activity frequency. Example: if Delegate A engages with posts related to Mission A, B, and C, this counts as 1 feedback instance, linked to a single example of their forum contributions.
-
Technical Limitations: The correlation between forum usernames and on-chain addresses presents verification challenges absent clear identifying markers (e.g., ENS alignment), potentially affecting the comprehensiveness of cross-platform participation tracking.
Participation Record
Top 100 Delegate Votes (Cycles 32–38)
We took a snapshot of the top 100 delegates at the start of Season 7 and tracked their participation in Agora and forum. The tracker can be found here:
Total Season 7 Participation in Numbers
The Figure 6 below provides a breakdown by proposal, showing the number of votes, rationales on Agora, and forum feedback entries.

Figure 6: Breakdown by proposal.
Top 100 Delegates Voting in numbers
Special Voting Cycles 31a-31b
Within the 19 proposals of the special voting cycle, 45% of the Top 100 delegates voted in every single proposal, while conversely 39% did not participate at all. On average, 51.6 delegates voted per proposal. 41% of the delegates made at least one forum interaction, while the rest made none (it is important to recall that this is independent from voting activity).
The proposal with the highest turnout among the Top 100 was Security Council Elections Cohort B Members, with 57% of voting participation. This proposal also attracted the most engagement, with 15 rationales and 32 pieces of feedback in the forum (many of them approvals).
Participation differed between cycles, with 31a averaging 48% votes per proposal, while the subsequent cycle increased by 7.4%. The proposals receiving the least engagement were the Grants Council Mission [Onchain] and Decision Market Mission [Onchain], both attracting 48 delegate votes.
Cycles 32-38
Analysis of the eight proposals during Season 7’s main voting period (excluding special cycles) demonstrates that 26 delegates maintained perfect voting records (26% of the top 100), while 39 delegates abstained completely. Forum participation remained limited, with 75 delegates from the top 100 showing no forum activity throughout cycles 32-38. However, it’s important to clarify that this forum absence did not indicate voting disengagement, as only 26 delegates failed to vote on any proposal.
Average participation reached 44.3 delegates voting per proposal, indicating that fewer than half of the top 100 actively engaged in each vote. These calculations excluded optimistic approvals, which operate under different participation mechanics. The Security Council Elections Cohort B Members again achieved the highest turnout with 51 delegates voting, while maintenance upgrades received minimal attention due to their optimistic approval status.
Engagement analysis considering votes, rationales, and forum interactions identified the Season 8 and 9 Milestone and Metrics Council Selection as generating the most comprehensive delegate involvement. Predictably, optimistic approvals for maintenance upgrades recorded the lowest interaction levels.
Season 7 Overall (Cycles 31a- 38)
To begin with, 26 of the Top 100 delegates participated in every vote, while 35 delegates did not vote at all throughout Season 7. This means that 35% delegates did not participate at all, while 65% participated in at least one vote.
Figure 7 is a heatmap that shows delegate participation across all proposals in Season 7, covering cycles 31a through 38, by illustrating how many times each delegate cast a vote.
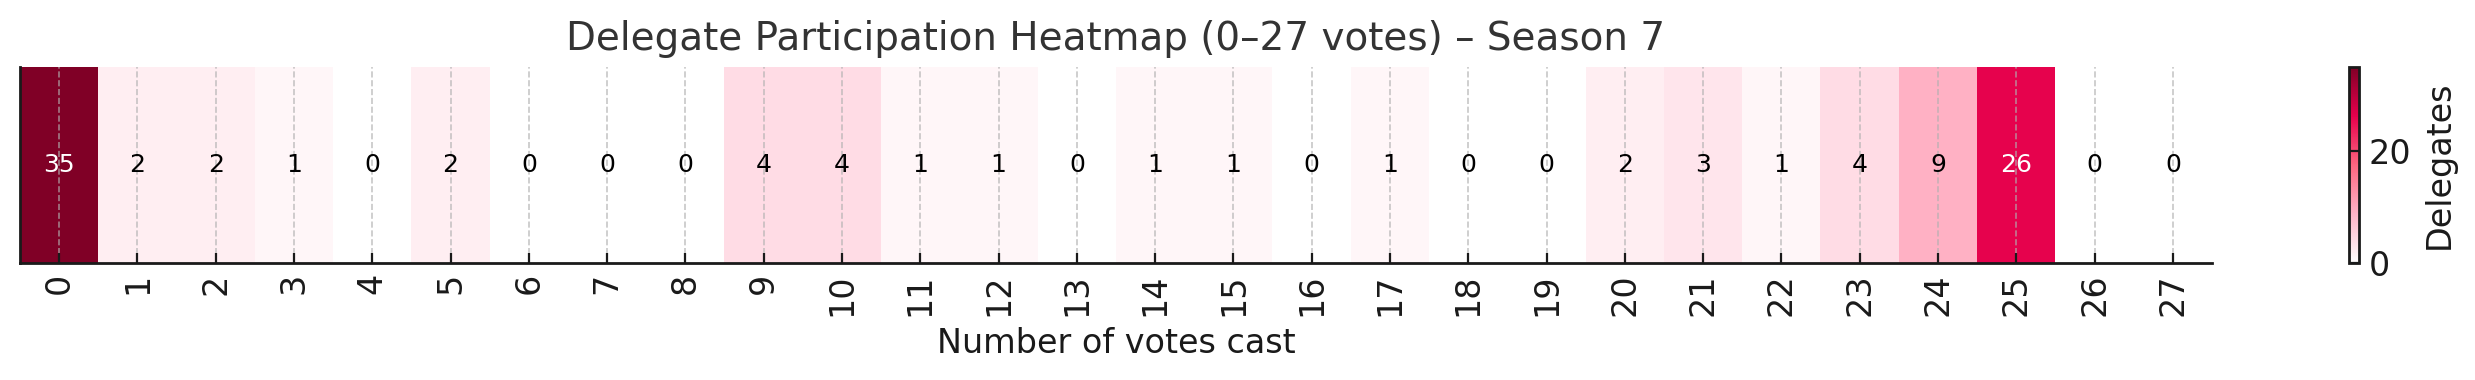
Figure 7: Delegate Participation Heatmap
The extremes of participation are the most striking: many delegates either voted in all proposals or in none, with relatively fewer falling in the mid-range (1 to 8 votes).
Taking Cycles 31a through 38 together, an average of 49 delegates out of the Top 100 voted per proposal, excluding optimistic approvals. This represents a 6.84% increase compared to the preceding Season, where the average participation was 45.86/100 votes. In other words, participation rose slightly but remained stable. This suggests that mechanisms like optimistic approvals do not reduce participation; rather, engagement levels remain nearly identical to those of the previous Season.
Regarding feedback, between Cycles 31a and 38 there was an average of 7.4 forum interactions per proposal from the Top 100 delegates. This is relatively stable compared to 8.39/100 in Season 6. Of these, a share corresponded to approvals, not necessarily “substantive” feedback. But this is nevertheless an essential action to ensure proposals moved forward to a vote without delays, especially across special cycles.
In total, the Top 100 delegates cast 1247 votes, nearly the same as in the previous Season (1284), representing a slight 2.88% decrease. Rationales on Agora totaled 313, a 21.95% decrease compared to Season 6 (401). Forum feedback entries numbered 185, also lower than the 232 recorded previously (a 25.41% drop). This marks rationales and feedback as the main areas where participation declined.
The proposal with the most votes from the Top 100 delegates was again Security Council Elections Cohort B Members, with 57% participation. This continues a trend already visible in Season 6, where Security Council Elections: Cohort A Lead and the Granite Network Upgrade had been the most popular votes. The highest individual proposal interaction in Season 7 reached 83, which was 14.46% lower than the previous peak. Conversely, the lowest level of individual engagement was just a single forum feedback entry with no votes from the Top 100, recorded in Maintenance Upgrade: L1 Pectra Readiness and Maintenance Upgrade: Absolute Prestate Updates for Isthmus Activation & Blob Preimage Fix; both optimistic approvals where delegates are not expected to act unless voting against.
A consistent trend from the previous Season is that rationales and feedback submissions remain relatively lower compared to votes. Votes represent 71.5% of Top 100 delegate participation, while rationales account for 17.9% and forum feedback 10.6%, as illustrated in Figure 8.
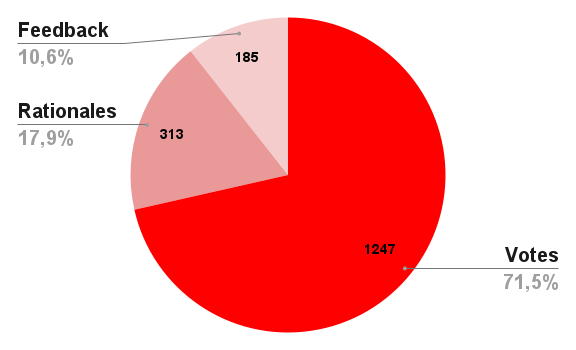
Figure 8.
Participation by Proposal Type
Figure 9 presents a bar chart showing the number of votes, rationales, and feedback received, broken down by proposal type throughout Season 7.
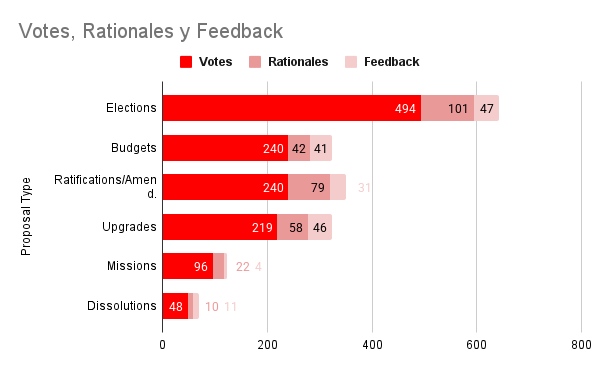
Figure 9: Participation by Proposal Type
- Elections concentrate the highest number of votes (494), showing clear salience for delegates.
- Ratifications generate the most rationales (79), indicating more justification around governance rules.
- Budgets and Upgrades attract similar levels of forum feedback (41–46).
- Missions and Dissolutions show lower overall engagement.
When looking at the distribution by proposal type, Elections were the category that mobilized the highest number of votes and forum activity: Security Council Elections Cohort B Members, with 57 votes, followed by the Grants Council Elections, each with 56 votes. This isn’t new and follows the trend from the previous season, where proposals related to elections and security upgrades (e.g., Security Council Elections: Cohort A Lead, Granite Network Upgrade) were the ones that had higher engagement.
Figure 10, below, shows the percentage of votes provided for each type of proposal in Season 7:
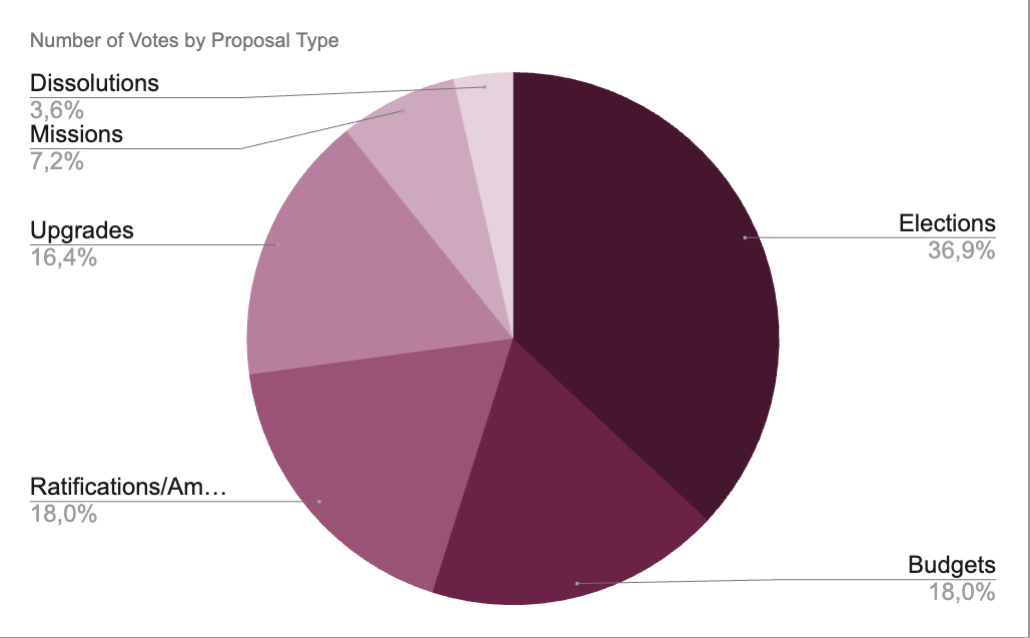
Figure 10: Number of Votes by Proposal Type
If we evaluate rationales, Ratifications/Amendments were the proposals where delegates provided the most justifications. The Season 8 and 9 Milestone and Metrics Council Selection had 27 rationales, while the Season 7 Intent Ratification received 18. This could indicate that delegates are more likely to explain their decisions when governance rules are at stake.
Figure 11 shows the percentage of rationales provided for each type of proposal in Season 7:
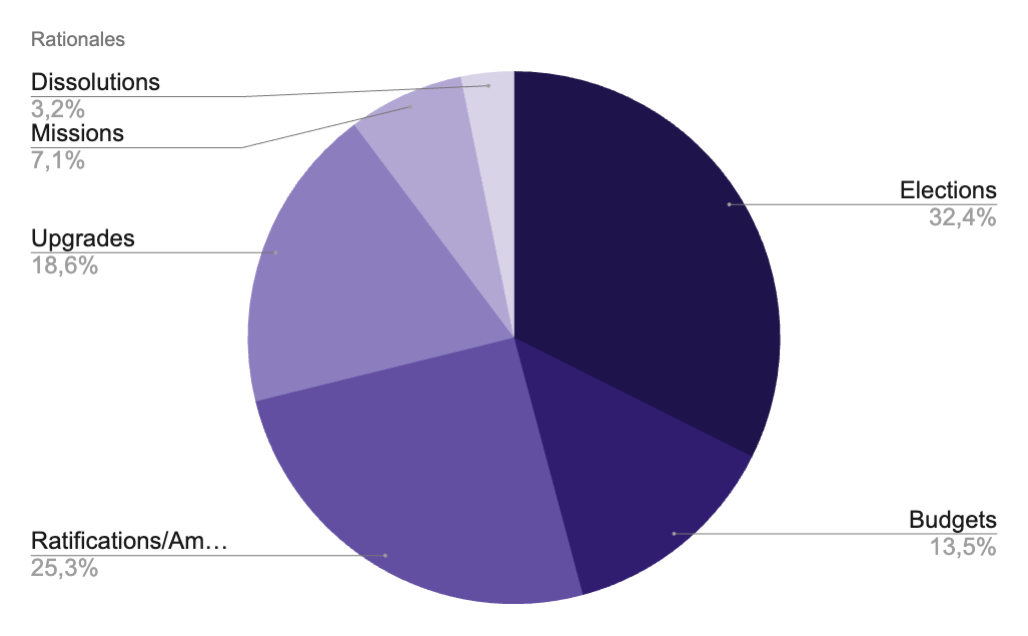
Figure 11: Rationales
Moving on, Budgets attracted medium levels of feedback. For example, the Grants Council Operating Budget received 14 forum comments (several of which were approvals required for the budget to proceed to a vote), while the Milestones and Metrics Council Budget reached 8.
In the case of Upgrades, forum participation was generally lower, except for the Holocene Network Upgrade, which stood out with 50 votes, 12 rationales, and 12 comments. This may be due to the higher technical knowledge required, which limits the number of delegates with the skills to engage, while another interpretation could be that it reflects strong alignment within the Collective around the technical improvements being implemented.
Missions and Dissolutions are the ones that generated the lowest engagement. Both the Grants Council Mission [Onchain] and the Decision Market Mission [Onchain] received fewer than 50 votes, and the Code of Conduct Council Dissolution Proposal gathered only 11 forum comments.
Figure 12 presents a pie chart showing the percentage of feedback received by different proposal types throughout Season 7:

Figure 12: Feedback
OPTIMISTIC APPROVALS
Optimistic approvals are a governance mechanism where, instead of requiring explicit affirmative votes, a proposal is considered approved unless delegates actively reject it by voting Against. Regarding quorum, they are defined as follows: “This proposal will automatically pass unless 12% of the votable supply of OP is against”. Their use for protocol upgrades seeks to make processes more direct and simple for delegates. In season 6 there were 2:
- Maintenance Upgrade: L1 Pectra Readiness which was approved with only 0.82% (787,507 OP) voting against, and, Maintenance Upgrade: Absolute Prestate Updates for Isthmus Activation & Blob Preimage Fix which had 1.87% (1,788,357 OP) votes against.
When measuring participation, we did not include optimistic approval votes, since they follow a different mechanism. Counting them in the averages would artificially lower participation rates: although delegates don’t need to vote if they agree with the proposal, this doesn’t mean their engagement in forums or other types of votes should be considered any less.
Delegate Participation by Voting Power
To deepen the snapshot of the composition of Top 100 delegate votes, we also stratified them by Voting Power tiers as follows:
- ≥ 5 M OP
- 1.5 M – 5 M OP
- 1 M – 1.5 M OP
- 250 K – 1 M OP
- 1 – 250 K OP
Figure 13 below, shows the percentage breakdown by tier, illustrating how many delegates in each voting power range participated across all proposals:

Figure 13. Delegate Participation by Voting Power Tiers
Delegates with more than 5M in voting power represent only 7% of the top 100, yet in addition to holding the largest share of voting power, crucial for guaranteeing quorum. This aligns with our earlier report on whales in the Collective: The Weight of Influence: An Analysis of the Power in the Collective. They also show strong engagement, with 71,48% of this tier participating and an average of 12 votes per delegate.
The 1.5M-5M tier accounts for 7% of the top 100 delegates and contributed 121 votes in total, averaging 17 votes per delegate. This is slightly higher participation relative to their size than the >5M tier and very consistent, with 86% of the delegates in this tier participating in at least one vote.
The 1M-1.5M tier has 22 delegates who are active participants (they cast 321 votes in total) which works out to nearly 15 ballots each. This group is one of the more reliable mid-high tiers, contributing about 25.7% of all Top 100 delegate votes. Interestingly, roughly 68% of delegates in this tier voted at least once, which signals consistent engagement across the group.
The 250k-1M tier includes 20 delegates who cast 272 votes, resulting in an average of 13.6 ballots per delegate. This group contributes 21.8% of total voting activity during Season 7 and serves as a stabilizing force, maintaining consistent participation levels just below those of the 1M-1.5M tier. Within this tier, 75% of delegates participated in voting.
The 1-250k tier is by far the largest group, making up 43% of the top 100 (with 43 delegates). Together they cast 449 votes, averaging just 10 per delegate (the lowest across all tiers). Participation within this group is heterogeneous: some delegates are consistent voters, but almost half (47%) didn’t cast a single ballot, while 53% voted at least once. This erratic engagement creates a paradox: the tier is unpredictable and adds volatility at the lower end, yet thanks to its sheer size it still delivered the largest share of total votes in Season 7 (36%).
Overall, the data shows that the mid-tier delegates (250k-1.5M) are the most active: around 75-85% of them voted, with averages of 13 to 17 ballots per delegate during Season 7. While they cannot define outcomes on their own, they help stabilize voting power within the system. Smaller delegates (<250k), on the other hand, display more irregular patterns: 47% did not vote at all. This suggests that the legitimacy of the Collective does not rest solely on “whale” participation, but also finds balance in the mid-tier delegates, who consistently contribute diversity and stability to collective decision-making.
Final Thoughts
Growth
Season 7 left an ambivalent signal: on one hand, the structure expanded with the independence of the Milestones & Metrics Council and the consolidation of other bodies like the Security Council; but at the same time, the number of unique individuals in the main bodies decreased by 11% (from 45 to 40). Even counting the ACC, growth was slight: 3.2% more than in Season 6. This can be read as a step toward a more minimalist design that prioritizes long term stability and continuity of a core of experienced contributors. At the same time, it shows that the expansion in roles has not yet translated into a broader opening of participation. Some forum discussions have highlighted that there are currently fewer entry points into the collective for new actors. The Anti-Capture Commission, for example, once offered delegates a way to gain context while also showing commitment. An interesting challenge and opportunity for the coming seasons will be to create new pathways to keep bringing fresh, talented voices into the Collective while balancing operational efficiency with long-term goals of decentralization.
Minimalist = Professional Governance
Although there is a trend toward reducing structures (for example, with the dissolution of councils like the Code of Conduct in season 7 along Anticapture Commission and Collective Feedback Commission during season 8) the governance system is evolving rather than contracting. As earlier mentioned, Season 7 had a modest +3.2% growth compared to Season 6. The system is maturing by concentrating expertise and optimizing its operational framework.
Stable Voting Participation Against Optimistic Approvals Expectations
On average, 49 of the top 100 delegates voted per proposal (+6.8% increase compared to S6). Although it was expected that the optimistic approvals mechanism would reduce involvement, participation remained virtually the same. This suggests that the minimalist design can keep the collective’s operations running without cutting into participation.
Operating Costs Grow Alongside the Maturation of Roles
The governance budget for Season 7 reached 1.055.000 OP, a 38% increase over Season 6. This rise does not reflect more bureaucracy, but rather the professionalization of functions: the DAB, for example, increased its budget by 47% compared to the previous season, expanding its structure with more specialized teams. In addition, for the first time the Security Council’s budget (295k OP) was made public, which explains the increase.
(Due to the forum’s character limit, we’ll continue in comments)