S7 Grants Council Impact Analysis

TL;DR:

  • An observational analysis of S7 Grants Council grants measured OP-normalized ROI using net Superchain TVL inflows between March 20 and June 12, 2025.
  • ROI benchmarks emerged at $1.58 (25th percentile), $3.67 (median), and $9.39 (75th percentile) per OP, providing reference points for the evaluation of future grants.
  • In total, the net TVL inflows attributable to the TVL-focused grants amounted to $65.3M.
  • Observational data suggests that grants generating both strong TVL growth and higher volume per TVL may be indicative of more sustainable net TVL inflows, though conclusions are preliminary.

Context

In S7, the Collective rallied around the North Star metric of Superchain TVL growth, honing in on initiatives most likely to drive outsized impact towards this Intent. Consistent with this concerted effort, it’s crucial to ensure that all Collective programs—ranging from SuperStacks to Futarchy—are assessed in a unified manner using the same framework, paving the way for a universal, OP-normalized ROI analysis.Against this backdrop, we conducted an observational impact analysis of the grants the Grants Council made in S7, which concluded on June 12, 2025. The intended purpose of this post is to contour preliminary learnings to help inform OP allocation decisions in the S8 cycle.

Methodology

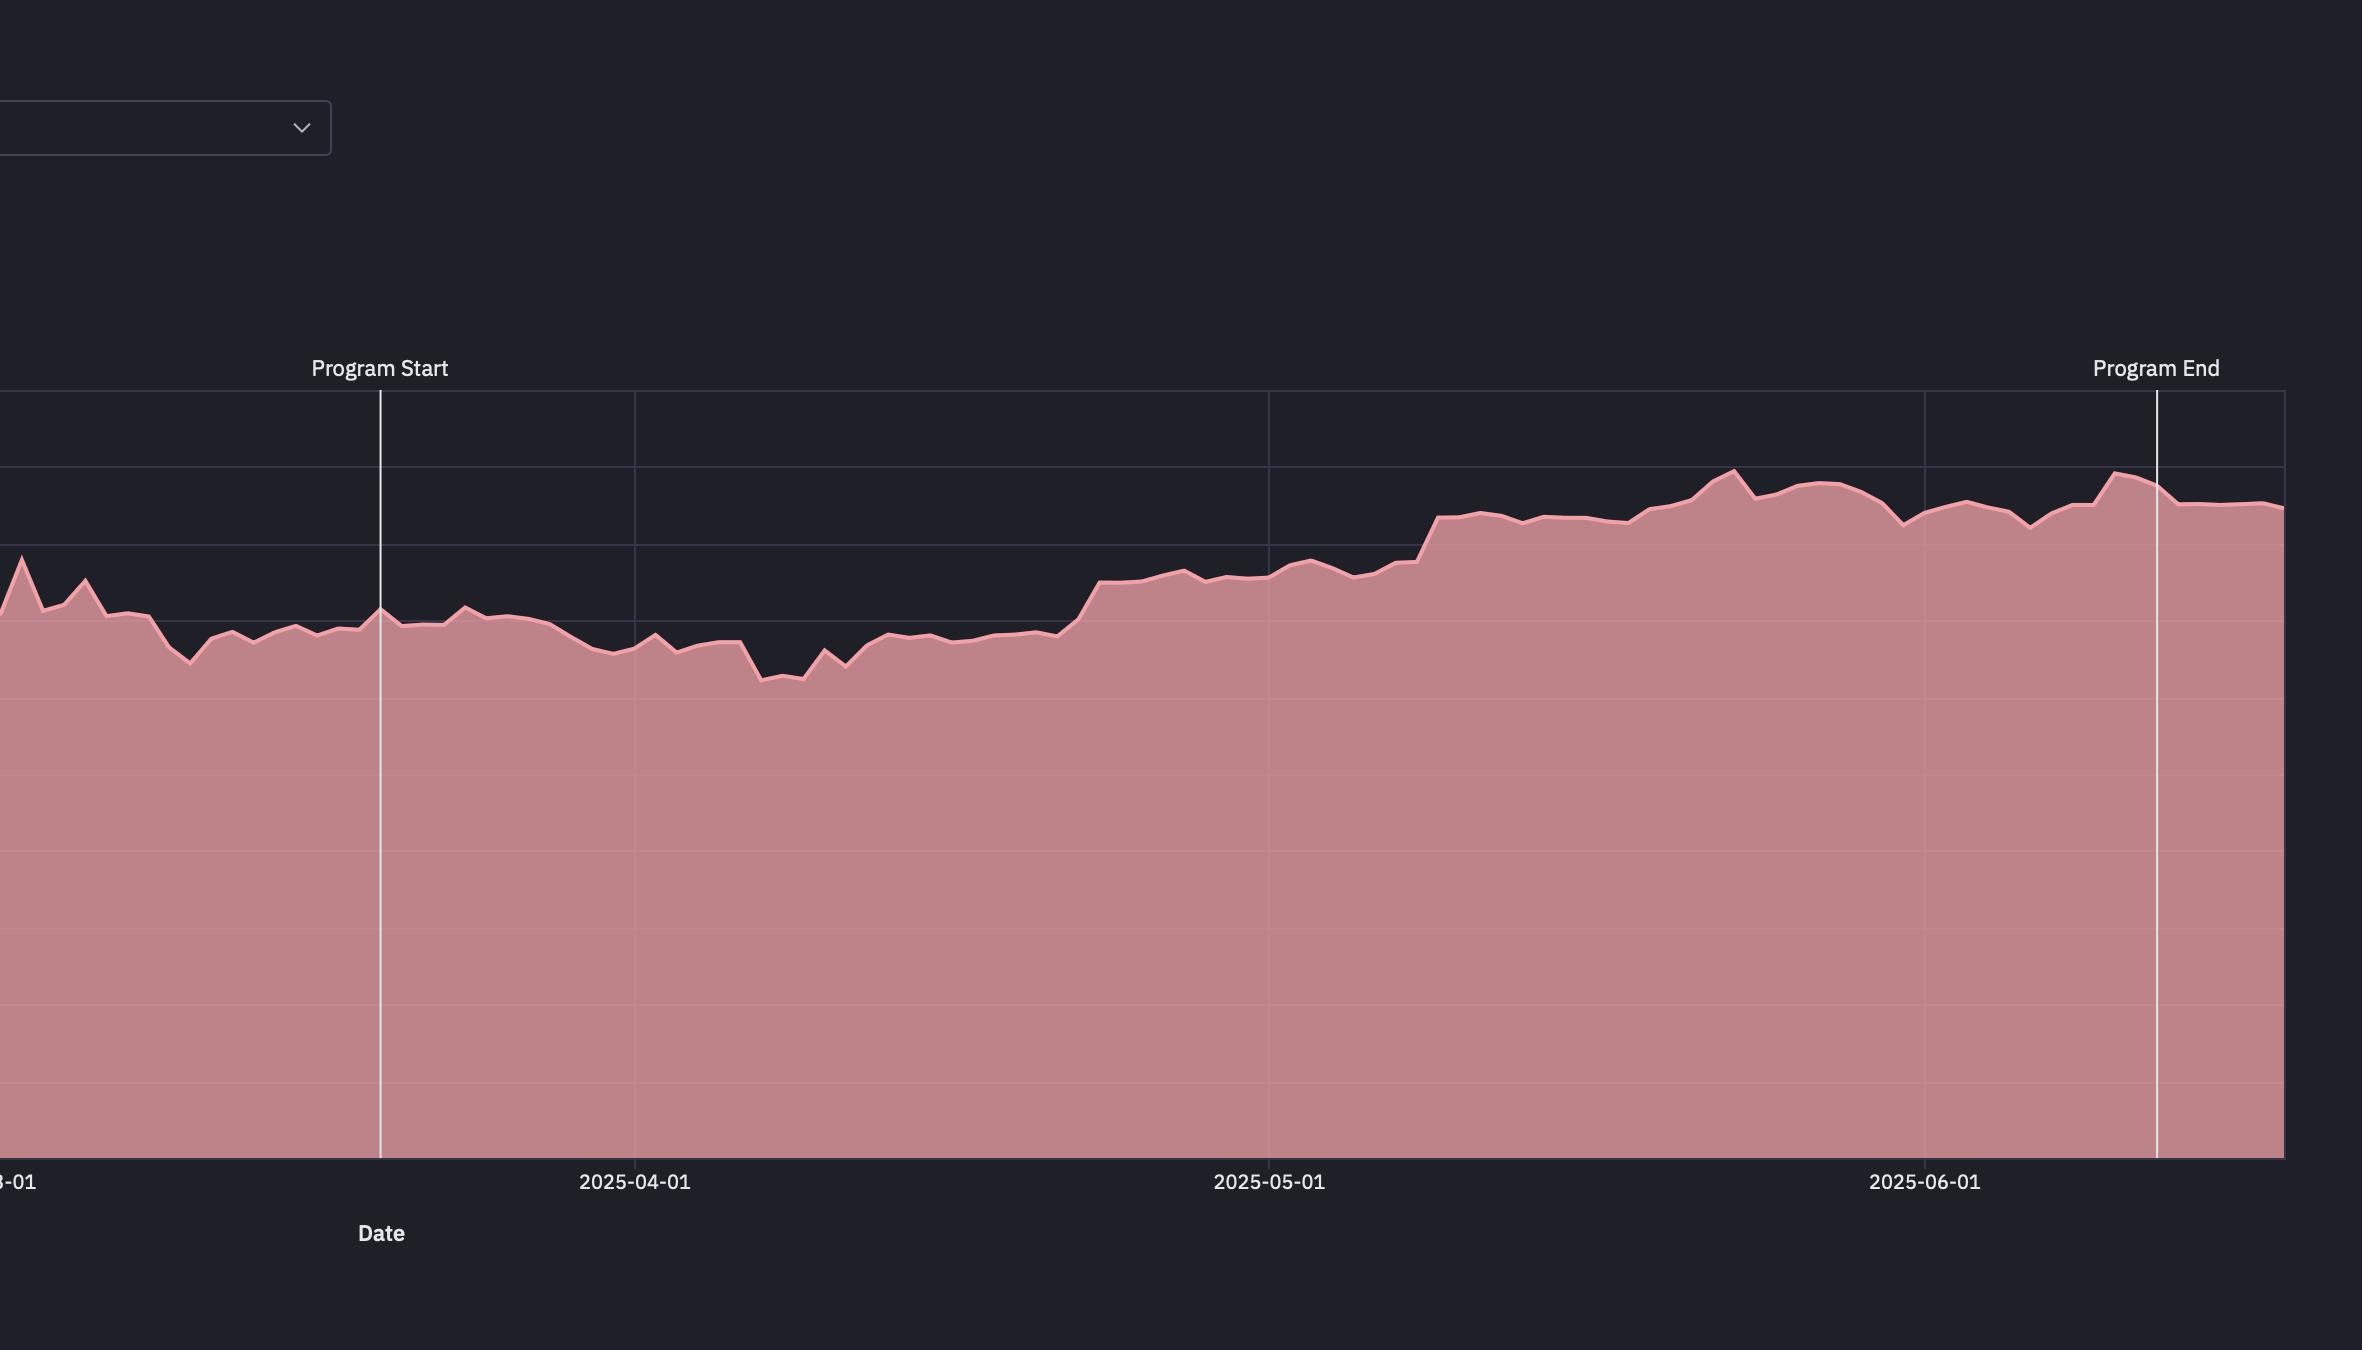
The Foundation collaborated with OpenSource Observer to conduct an observational analysis of net TVL inflows between March 20 and June 12, 2025, which represented the defined incentive period for the issued grants. The analysis focused exclusively on grants that targeted Superchain TVL growth, excluding audit grants, which comprised 10.6% (~990K OP) of the total budget.

For the TVL measurement, we relied on the definition outlined in this glossary and leaned on DefiLlama as the primary data source. Furthermore, the TVL measurement was narrowed down to the chains within the Superchain that the grant intended to impact, as per incentive distribution plan outlined in the grant applications.

In terms of impact attribution, we tried to account for grant scope specificity and concurrently deployed co-incentives targeting the same chains. Specifically, we incorporated this logic into the TVL calculation by lowering the net TVL inflows attributable to the respective grants if other co-incentives were known—either because it was explicitly mentioned in the grant application or because it was public knowledge (e.g. inclusion in SuperStacks)—or if the grant aimed to only incentivize a small subset of the chain’s total market (e.g. a single stablecoin vault).

For example, Sake Finance had net inflows of $9M during the grant period, but this coincided with Soneium’s ACS campaign (which allocated a total of 70M ASTR to DeFi protocols) as well as SuperStacks (which allocated an additional 2M+ in DeFi incentives across the Superchain). Sake Finance was a participant in all three of these incentive programs. As a result, we apply a discount to the net TVL inflows that are attributable to the Grants Council program.

While perfect TVL attribution is very hard to achieve, factoring in known confounding variables could help us better approximate reality. We erred on the side of providing more conservative estimates initially. Note that the Foundation applies exactly the same attribution logic to any internal analyses of Foundation-owned programs.

Key Findings

To standardize TVL measurement, we aggregated results to establish baseline ROI benchmarks that can be used across seasons. At the aggregate level, S7 GC grants achieved $9.39 in net TVL inflows at the 75th percentile and $1.58 at the 25th percentile), offering reference points for future ROI evaluations.

Note that these benchmarks should not be seen as an end-all-be-all measuring stick for future grants, but instead could serve as a proxy for evaluating future performance. For context, these results fall below benchmarks from previous growth grants (P75: $37.93; P50: $13.83; P25: $0.73), as determined by an analysis from the data team at OP Labs.

In total, the net TVL inflows attributable to the TVL-focused grants amounted to $65.3M. To put this into perspective, preliminary results from SuperStacks—a DeFi incentive campaign run by the Foundation—indicate that the program has brought in $73.4 in net TVL inflows per OP as of last week.

S7 GC Grants Net TVL Inflows / OP At Program End (n = 17)
75th percentile $9.39
50th percentile (median) $3.67
25th percentile $1.58

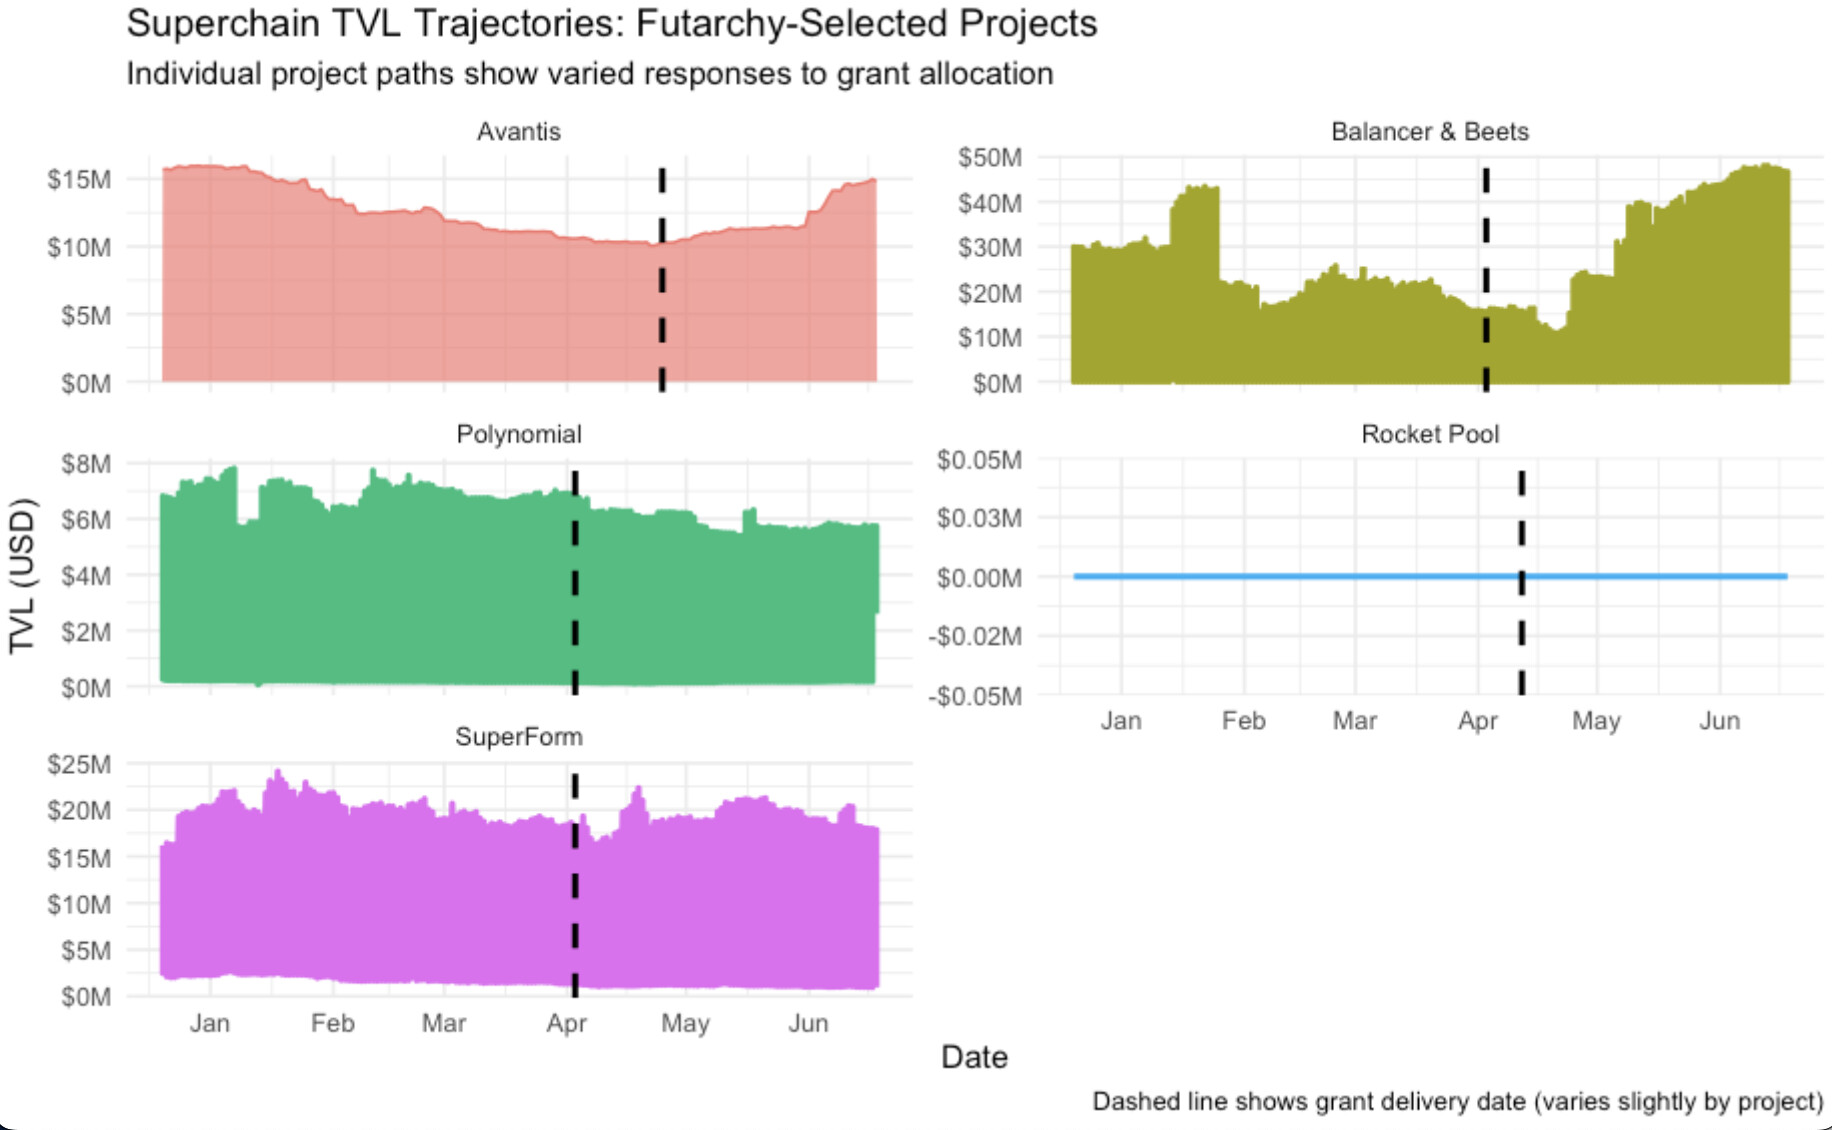
When taking the project-level ROI distribution under the microscope, it becomes apparent that net TVL inflows per OP follow a power law dynamic, with Morpho’s World grant yielding $44 / OP in attributable net TVL inflows and Euler’s grant achieving $24 / OP, while most other grants hover in the $1-10 / OP range.

Interestingly, top performing grants like Aerodrome and Uniswap showed not only notable TVL inflows, which indicates supply-side growth, but also high daily volume per TVL ($0.58 - $0.63), commonly used to gauge demand-side activity. In contrast, projects with lower net TVL inflows / OP demonstrated lower daily volume per TVL ($0.004 - $0.40).

Taken together, this might suggest that healthy demand-side activity in conjunction with significant supply-side traction might be indicative of successful DeFi ecosystem momentum. Note that this observation is based on a very small sample size and does by no means imply a causal relationship.

Conclusion

This preliminary analysis offers a first pass at understanding how effectively S7 Grants Council allocations translated into Superchain TVL growth. While attribution remains inherently complex, the introduction of OP-normalized ROI benchmarks—$1.58, $3.67, and $9.39 at the 25th, 50th, and 75th percentiles—provides a foundational reference point for evaluating future grants.

Early signals suggest that projects demonstrating both strong net TVL inflows and high volume per TVL may contribute more meaningfully to ecosystem growth. These insights, though directional, can help inform more data-driven OP allocation decisions in S8.

Appendix

8 Likes

Helpful report. Context down thread.

Small request: Either append future season reports onto this thread (perhaps lock it to avoid being too busy) or create a central locked post with links to each report for GC season and other programs as well? So it’s all in one place and easy to find as a historical document.

5 Likes

At the beginning of Season 7, I was provided with a “S7 Metrics Definition” document by the Foundation. We published this on the Grants Council homepage so applicants could clearly understand what types of TVL growth would be prioritized.

However, when comparing the final S7 Impact Analysis with the originally defined metrics, several inconsistencies emerge:

  • 3 out of the 4 declared verticals (Bridged Assets, Stablecoins, and Wrapped Assets) were completely missing from the report.
  • Attribution discounting logic was introduced mid-season and applied retroactively without disclosure.
  • A new metric, volume per TVL, was added after the fact as a proxy for “sustainable usage,” despite never being part of the guidance provided to applicants.

A concrete example of the consequences of this misalignment is the grant awarded to Spark.

Their proposal explicitly aligned with all four verticals defined at the start of Season 7:

  • Spark Savings and the Spark Liquidity Layer were deployed across multiple OP Chains (OP Mainnet, Unichain, and Ink), addressing Superchain-wide TVL.
  • They introduced yield-bearing stablecoin products (USDC, USDS, and sUSDS), directly supporting the growth of stablecoin TVL.
  • sUSDS, as a wrapped asset representing interest-bearing USDS, fulfilled the wrapped asset TVL vertical.
  • The Liquidity Layer relied on canonical bridges and CCTP to move assets cross-chain, directly increasing bridged asset TVL.

Despite this, Spark’s contribution is entirely absent from the Foundation’s final report.

One reason: DeFiLlama does not measure the TVL of Spark’s protocol-issued assets (such as sUSDS and USDS) due to filtering heuristics. Despite Spark having around 400 million dollars in assets available for swaps, as verifiable onchain via the contracts below, those flows are excluded by design.

The result is a grant that followed every published metric and successfully deployed onchain, but appears to have had zero impact with a 2M OP grant, not because it failed, but because the measurement method of a 3rd party app.

I’m not asking for a retroactive correction of the analysis, I like the information provided, but given that Season 8 metrics for the Grants Council are already published, and that we’re expected to evaluate grants against those metrics, I need to understand how they’ll be measured before we open submissions.

I urge those in charge of the analysis to lock in the measurement methodology by July 25th, so I can work with the newly elected GC reviewers during the final week of July to align our internal filtering and scoring process with what will actually be measured.

4 Likes

Hey @Gonna.eth! Thanks for your thoughtful feedback! Providing some clarifications below:

3 out of the 4 declared verticals (Bridged Assets, Stablecoins, and Wrapped Assets) were completely missing from the report.

As outlined in the TVL definition you shared, Superchain TVL was the North Star metric in S7, which encompasses the three mentioned verticals, as they are specific subsets of total Superchain TVL. As such, they are indeed included in the report.

Attribution discounting logic was introduced mid-season and applied retroactively without disclosure.

The primary goal of this analysis was to approximate the TVL growth driven by the issued grants as closely as possible, helping the Collective make more informed token allocation decisions in future seasons. Importantly, the Foundation applies the same attribution logic to the programs it runs, which is a necessary pre-requisite for leveling the playing field and enabling accurate impact measurement across programs. Attribution is an inherently complex problem space and we’re always looking to refine existing approaches, so if you have any concrete suggestions for improvement, we’d love to hear them!

A new metric, volume per TVL, was added after the fact as a proxy for “sustainable usage,” despite never being part of the guidance provided to applicants.

It is important to note that volume per TVL was not used to assess impact. Instead, it was included simply to give more color to the analysis, which might equip the Grants Council with additional tools when selecting grants in the future. Hence, volume per TVL is merely a minor, inconsequential foot note in the overall evaluation.

Despite this, Spark’s contribution is entirely absent from the Foundation’s final report.

First and foremost, the Spark grant is not missing from the analysis. In fact, it is included with a contribution of $20M in net TVL inflows on Unichain, OP Mainnet, and Ink. In line with industry standards, this measurement is based on DefiLlama’s TVL methodology, which centers around app-level deposits. Notably, this differs from L2Beat’s Total Value Secured (TVS) methodology, which aims to capture the total value of assets onchain, including those sitting idle in contracts and EOAs.

That being said, the $400M locked in the Spark PSM contracts comprises protocol-controlled assets that sit idle onchain, and therefore fall under the TVS rubric but are excluded from the TVL calculation. We reached out directly to the Spark team to confirm this methodological detail. Conversely, the $20M captured in the analysis reflects active deposits into existing apps.

I urge those in charge of the analysis to lock in the measurement methodology by July 25th, so I can work with the newly elected GC reviewers during the final week of July to align our internal filtering and scoring process with what will actually be measured.

This is a valid point, and we’ll make sure to provide a detailed breakdown of the exact measurement methodology with the GC before July 25, so any ambiguity can be eliminated from the impact evaluation going forward.

Disclaimer: I work for the Optimism Foundation, but views are my own.

3 Likes

Quick clarification request. The report notes that SuperStacks has brought in $73.4M in net TVL inflows per OP. I wanted to confirm whether any part of that reported TVL includes Morpho deployments on Unichain.

No contracts were deployed for SuperStacks.
The contract being tracked by SuperStacks is the same one funded by the GC grant. All SuperStacks does in this case is track the contract and assign points to users who interact with it.

If Morpho’s TVL is included in the SuperStacks impact figure, I’d appreciate clarification on how that attribution is being handled.

Is any of that TVL being attributed to SuperStacks in the $73.4M figure mentioned in the report?

If so, it seems like we’re misattributing TVL that only exists because of a GC grant. @thbialek

2 Likes

Additional items to make sure the TVL is being attributed correctly. SuperStacks overlaps with a number of other incentives programs

In general, SuperStacks largely incentivized project-chain combinations that the GC selected or were already running major incentives campaigns. So let’s just make sure TVL growth is attributed by a standardized formula, like pro-rate contributions. We believe that a methodology was mentioned, so it would be great to see it worked through in an example.

It would also be useful to know if SuperStacks selected a project-chain combination to support before or after other incentives were announced. Identifying what to incentivize is a major use of time for the GC, so if SuperStacks will in the future continue to operate as a kind of follow-on matching pool of funds, for GC and chain incentives, that’s very useful for GC in S8 to be aware of to size grants appropriately.

2 Likes

I would love to have access to this doc to learn the formulas if you don’t mind.

1 Like

Thanks for the great feedback! Sharing additional context to help address open questions:

Quick clarification request. The report notes that SuperStacks has brought in $73.4M in net TVL inflows per OP. I wanted to confirm whether any part of that reported TVL includes Morpho deployments on Unichain.

For SuperStacks, the $73.4 in net TVL inflows per OP encompasses the 22 pools and vaults incentivized through the program. Notably, this also includes two Morpho vaults on Unichain, which were added to the program on June 16 for the final two weeks of the incentive period.

No contracts were deployed for SuperStacks.
The contract being tracked by SuperStacks is the same one funded by the GC grant. All SuperStacks does in this case is track the contract and assign points to users who interact with it.

SuperStacks is a classic DeFi incentive program designed to accelerate the growth of interoperable assets across the Superchain. Hence, it contributes directly to Superchain TVL growth, similar to many other initiatives launched in S7. Contributions to this metric should remain agnostic to the form factor of a program—be it liquidity mining, points, or another mechanism—as long as it drives meaningful impact.

Is any of that TVL being attributed to SuperStacks in the $73.4M figure mentioned in the report? If so, it seems like we’re misattributing TVL that only exists because of a GC grant. @thbialek

As mentioned before, the Foundation applies the same measurement framework to SuperStacks, including the attribution methodology. Just as portions of the TVL growth on Sake Finance are attributed to both the GC’s grant and Soneium’s ACS campaign, the TVL growth from co-incentivized Morpho vaults is also split accordingly.

In general, SuperStacks largely incentivized project-chain combinations that the GC selected or were already running major incentives campaigns. So let’s just make sure TVL growth is attributed by a standardized formula, like pro-rate contributions. We believe that a methodology was mentioned, so it would be great to see it worked through in an example.

We applied a standardized attribution adjustment to each project’s observed TVL growth. This adjustment prorated impact based on (1) the relative size of other incentive programs running concurrently with the GC grants, and (2) the proportion of targeted pools or vaults relative to the protocol’s total TVL on the targeted chain. The attribution percentages applied ranged from 1% to 50%.

It would also be useful to know if SuperStacks selected a project-chain combination to support before or after other incentives were announced. Identifying what to incentivize is a major use of time for the GC, so if SuperStacks will in the future continue to operate as a kind of follow-on matching pool of funds, for GC and chain incentives, that’s very useful for GC in S8 to be aware of to size grants appropriately.

Pre-existing co-incentives were not a strict requirement for SuperStacks, and assets were selected based on interop compatibility and DeFi ecosystem growth dynamics. This is valuable feedback, and we’ll aim to share more context with the GC for future Foundation-run incentive programs to better harness potential synergies and maximize the overall impact.

I would love to have access to this doc to learn the formulas if you don’t mind.

You can find the dashboard in the Appendix section, which features a tab with the full code.

Disclaimer: I work for the Optimism Foundation, but views are my own.

1 Like

Can you explain the formula for this attribution share? They don’t make a lot of sense on the surface.

For example, Spark would not be deployed if not for the Grants Council grant. Yet 50% of TVL is not attributed.

The same logic was applied to Fluid on Superchain, another project where the grant was to get the deployment. (In this case TVL is currently 0, so it doesn’t change the numbers, but illustrates the point)

But let’s set the Attributed variable aside for the moment and address some major problems with these calculations.

It’s clear upon closer inspection that the reported numbers are, in fact, completely unusable. The TVL change does not actually measure the correct beginning date (which will be different for each project). The OP spent is overstated.

Let’s go through an example where this is obviously the case.

Bedrock was approved for a grant of 235k OP. Bedrock didn’t even begin to draft their application until March 26, clear intake until April 21, and be approved on until May 5. Zero OP was delivered until May 29. Yet we see here that TVL is being measured from March 20. The TVL changes need to be recalculated based upon some meaningful beginning date. Suggestions are OP delivery or announcement of campaign by the grantee.

Next, the OP attributed to this grant is being calculated on the entire grant rather than the OP actually delivered to the grantee. The denominator in dollars per OP needs to be recalculated.

Let’s use the provided data, even though the Attributed variable of 15% could be debated, and the increase in TVL is clearly measuring the wrong period. Just to illustrate how impactful this distinction is.

($8,520,000 TVL Increase * 0.15 Attributed) Ă· 235,000 OP Total Grant = $5.43 per OP

That’s very different from:

($8,520,000 TVL Increase * 0.15 Attributed) Ă· 94,000 OP Actually Delivered = $13.59 per OP

This is very important, because undelivered OP has not yet been spent. In fact, many grantees may not hit their milestones and never get the second tranche of funding at all.

As you can see, all of these numbers need to be recalculated using the correct beginning dates and the amount of OP actually delivered.

CC: @lavande who can help whomever did these numbers find relevant information, and to see if the SuperStacks, Futarchy, and other numbers likewise need recalculation

1 Like

Appreciate this deep dive by GFX labs, and makes total sense.

Are these numbers going to be recalculated?

1 Like

The benefits of working with a third party to do analysis is that we remove the opportunity for bias or conflicts of interest in how the information is presented. The natural downside is that the third party may lack important context or nuance, which the programs being developed can provide.

I believe the Foundation did offer to have the Grants Council review the analysis before it was published, but that offer was declined. In any case, I am happy to connect you/ the Grants Council with the report authors to ensure all relevant nuance/context is incorporated so we can arrive at the most accurate analysis possible. This is a feedback loop which we will need to strengthen in future Seasons.