This analysis was made for the numbaNERD program.
I used DUNE and Flipside for this analysis. All metrics come from the queries that I wrote myself.
You can find links for the embedded version of the graphs just below them.
I have excluded transactions associated with the contract address ‘0x4200000000000000000000000000000000000015’ from this analysis. This contract is internal and is used for configuring L1 block values.
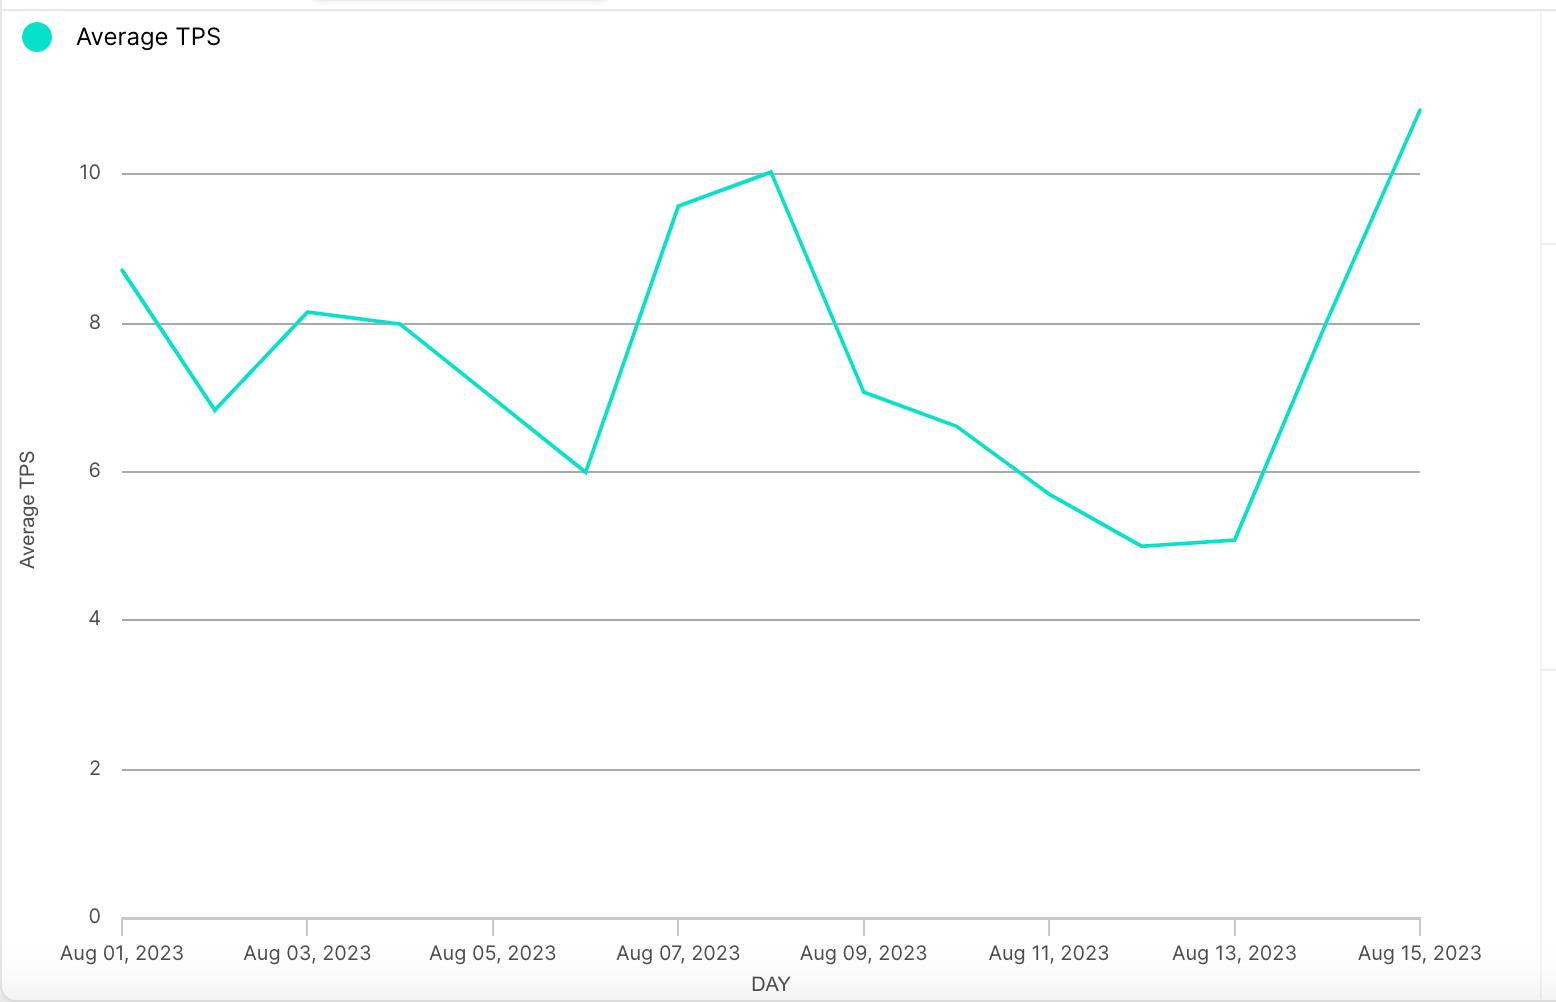
During the first half of August, the Optimism Mainnet processed a total of 9,048,924 transactions. Out of these transactions, half, or 4,524,462, passed through 64 different contracts. The network accumulated a total of 994 ETH in transaction fees during this period. Additionally, the daily average transactions per second (TPS) fluctuated within the range of 5.02 to 10.85.

Link for the dynamic versions of these graphs
To estimate the popularity of applications, I intend to present a pie chart. This chart will display the distribution of transactions categorized by contracts.

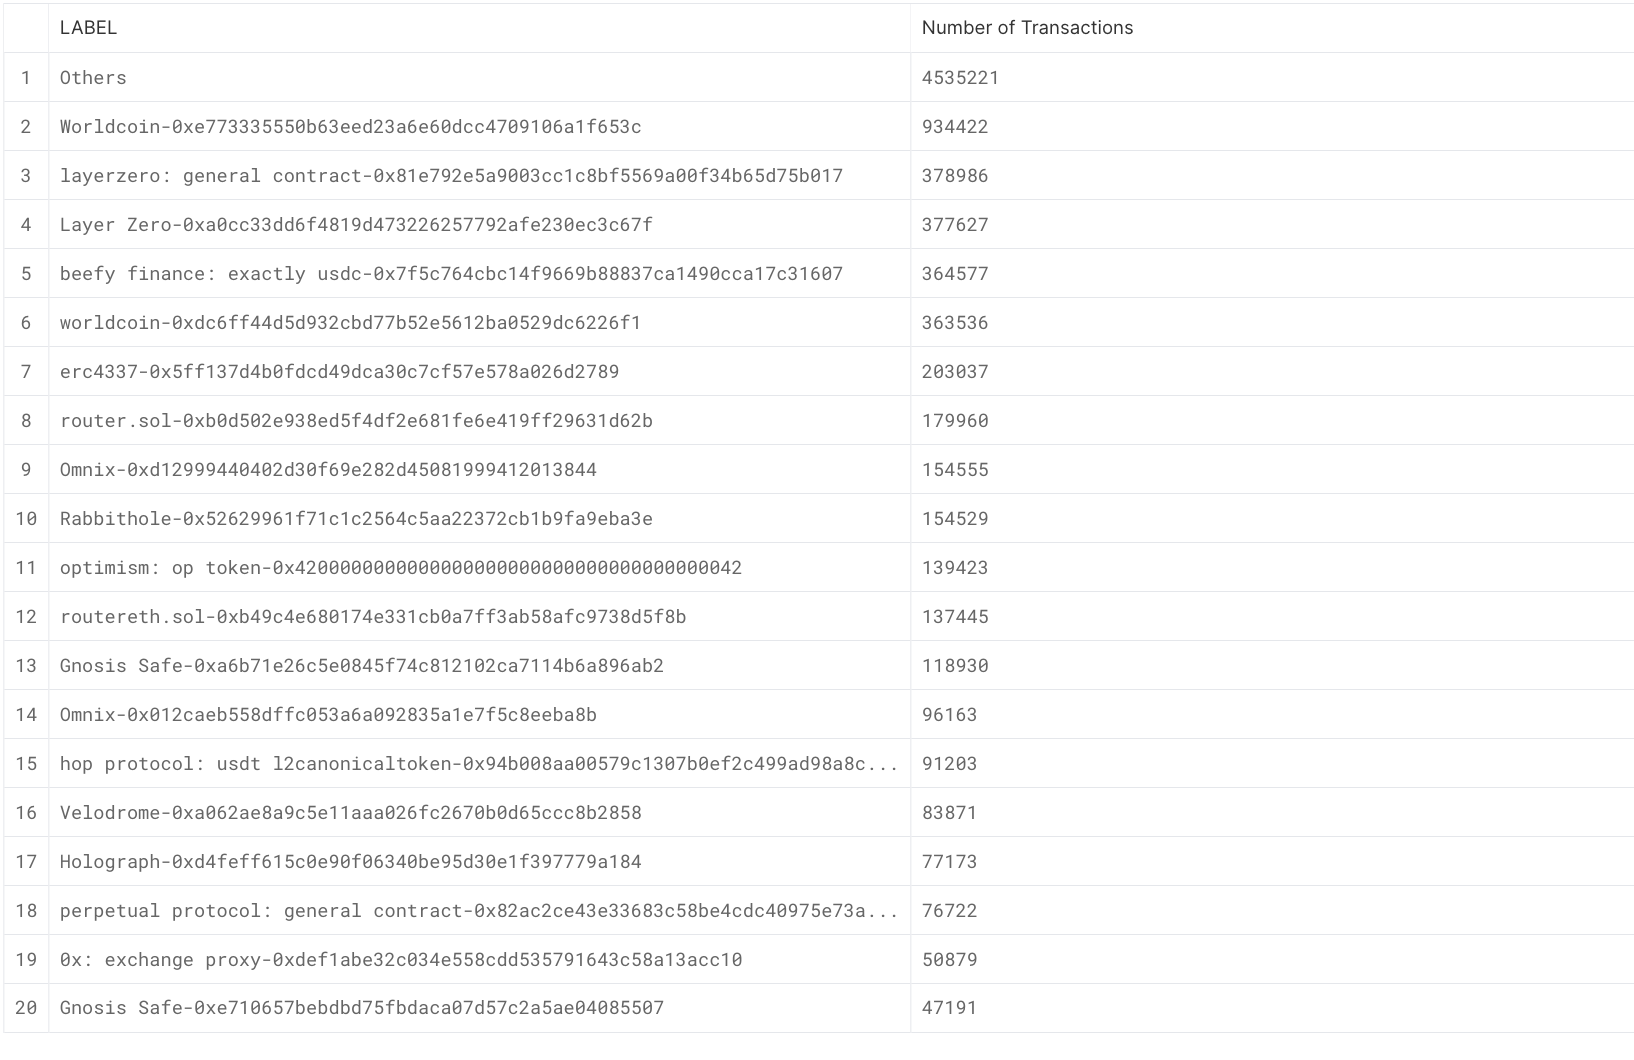
From both the table and the graph, it becomes evident that Worldcoin and Layer Zero are the leading contenders in this competition. Surprisingly(at least for me), Beefy Finance’s USDC contract follows closely behind, a fact that caught my attention. Worldcoin, launched on July 24th, has generated significant excitement within the crypto community. This heightened interest can be attributed to the project’s unique nature and the notable figure spearheading it, Sam Altman, CEO of OpenAI. As for Layer Zero, there appears to be a distinct presence of airdrop hunters on Twitter, which could potentially contribute to increased usage and engagement with the Layer Zero platform.

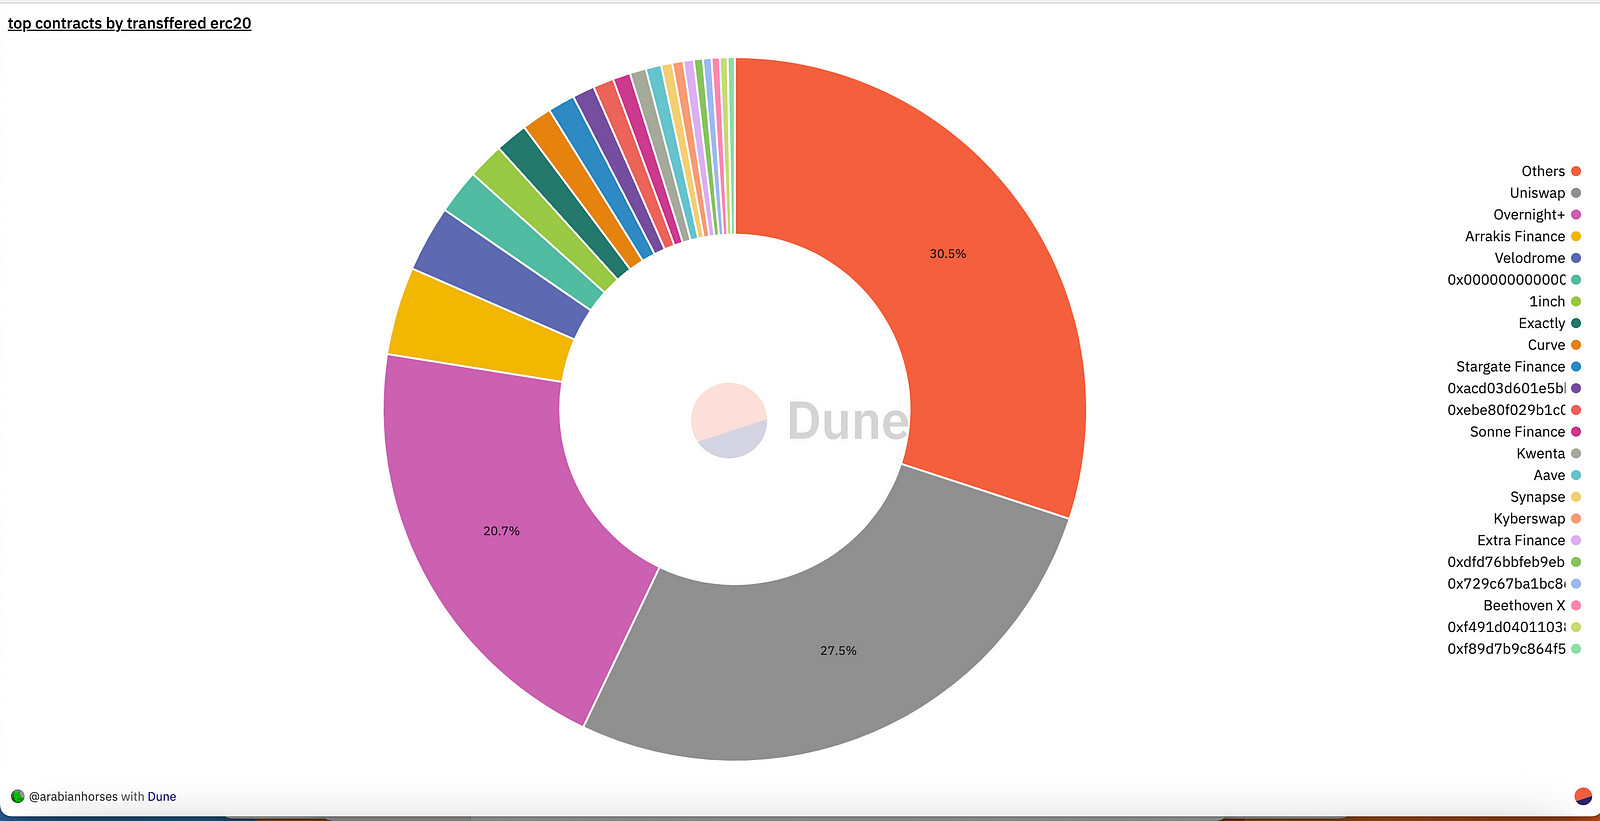
This analysis has primarily been focused on the number of transactions, which provides valuable insights. However, to gain a more comprehensive understanding of the capital flow, it is imperative that we track asset movements. To address this, we will introduce another pie graph, distinct from the previous one, as it will not be based on transaction counts. As I mentioned earlier, this graph will illustrate the transferred value associated with each contract. It’s important to note that this graph exclusively covers ERC20 transfers. This approach, which accounts for the use of ETH in DeFi as wrappedETH, is expected to yield more accurate and meaningful results in assessing capital movement within the ecosystem.
Having assessed popular contracts, protocols, and the direction of capital flow, we can now draw some key observations. The embedded graphs can be accessed by clicking on the link below the respective screenshot.
Notably, Uniswap and Overnight+ emerge as the frontrunners in terms of ERC20 volume, followed by Arrakis Finance and Velodrome, with burn events representing a significant portion of this activity. This trend poses challenges for Total Value Locked (TVL) metrics, as assets being sent to the 0x000000 address are essentially withdrawn from the ecosystem. As you may be aware, when assets are withdrawn from the Optimism Mainnet, they are burned (sent to 0x00000), and an equivalent amount of assets is released from the Optimism L1 Escrow contract (Link).
To gain a better understanding of the changes in Total Value Locked (TVL) on the Optimism network, it’s essential to examine bridge activity. However, before delving into this analysis, it’s important to note the existence of third-party bridges. When users utilize a third-party bridge for withdrawals or deposits, they typically bridge their assets before conducting any transactions. Subsequently, when transactions are executed through these third-party decentralized applications (dApps), they often operate using their own reserved bridged assets. Essentially, these third-party bridges facilitate larger asset transfers from the official bridge, enhancing the user experience by offering immediate transfers, cross-chain withdrawals, and deposits, among other advantages.
This context is crucial to understand because when we analyze official bridge statistics, we are effectively examining the combined data from all bridges and monitoring the movement of TVL as a whole.
During the first half of the month, approximately $56.5 million USD worth of assets were deposited onto the Optimism network, while $41.2 million USD were withdrawn. This results in a net positive flow of $15 million USD into the Optimism ecosystem. In the subsequent analysis, we will visualize the change in TVL by plotting the difference between deposits and withdrawals on a line graph for a clearer depiction of this movement.

I would like to emphasize a pivotal metric that holds significant importance to me – the change in votable OP (Optimism token) supply. This metric is of particular significance due to the predominant role that governance currently plays in the utilization of the OP token. Hence, tracking the fluctuations in votable OP supply during the first half of August is a paramount aspect of my analysis.

We have observed a minor decrease in the votable OP (Optimism token) supply. It is my belief that investigating this metric over a 15-day period may not provide a comprehensive understanding, given the dynamics at play. I had initially anticipated more significant increases in this metric, considering the distribution of OPs through mechanisms such as the RPGF (Rewards Program for Governance Founders) over time. However, it is noteworthy that the metric has remained relatively stable. For a broader and more detailed view of this metric, I recommend referring to this dashboard.
Up to this point, we have examined fundamental metrics. Now, I would like to introduce some specialized metrics tailored to our analysis. Specifically, we aim to gain insights into the behavior of new users and determine which decentralized applications (dApps) are responsible for bringing new users to the Optimism Mainnet.
To achieve this objective, we will identify addresses that made their initial deposits onto the Optimism Mainnet during the first half of August. Subsequently, we will trace the destinations and purposes of these assets, shedding light on where and how they are being utilized within the ecosystem. Our investigation will provide valuable insights into the adoption patterns of new users, helping us identify the dApps that are effectively attracting and retaining them. Let’s proceed with this analysis.

In the pie graph presented, we observe the number of transactions initiated by new users, defined as addresses making their first transaction in the first half of August. The findings from this analysis have revealed several noteworthy observations.
Firstly, there were no significant surprises among the data, except for the presence of “Optimist NFT” and “Niftykit.” Prior to this analysis, my assumption was that only RPGF #2 voters were eligible to mint Optimist NFTs. However, upon examining this graph, I conducted further research and discovered that individuals who have completed Know Your Customer (KYC) procedures with a Coinbase wallet are also able to mint Optimist NFTs. For those unfamiliar with Optimist NFTs, further information can be found here.
Secondly, the data has raised questions about the NFT ecosystem on Optimism, which appears to be less active compared to previous periods. The absence of high-profile NFT projects that were prevalent earlier this year or last year was unexpected(IMO Optimism NFT ecosystem were ![]() ). This observation suggests that some users may be deploying NFTs for recreational purposes.
). This observation suggests that some users may be deploying NFTs for recreational purposes.
In the upcoming analysis, I plan to delve into the topic of the top (LSD) tokens. However, I will reserve further investigation of the NFT case for the following week.

I have conducted an analysis to identify the top three LSD tokens by balance on the Optimism Mainnet. During this analysis, a significant spike in the cbETH balance on August 10, 2023, caught my attention. The balance of cbETH on the Optimism Mainnet surged from 90 to 2,021 during this period.
This notable increase in cbETH balance on the Optimism Mainnet is likely attributed to a corresponding healthy rise in LSD token balances on the network. In my assessment, the rationale behind this surge is that individuals are interested in utilizing their LSD tokens within decentralized finance protocols. Due to the cost efficiency of the Optimism Mainnet compared to the Ethereum Mainnet in terms of gas fees, users seem to prefer Optimism for their asset interactions.
To gain a more comprehensive perspective on this phenomenon, it is essential to investigate the holders of these tokens. If externally owned accounts (EOAs) are the primary holders, this might challenge my initial hypothesis. However, if smart contracts are predominantly holding these tokens, it would substantiate my hypothesis that users are migrating their assets to the Optimism Mainnet for enhanced utility within DeFi protocols. Further analysis will provide clarity on this matter.

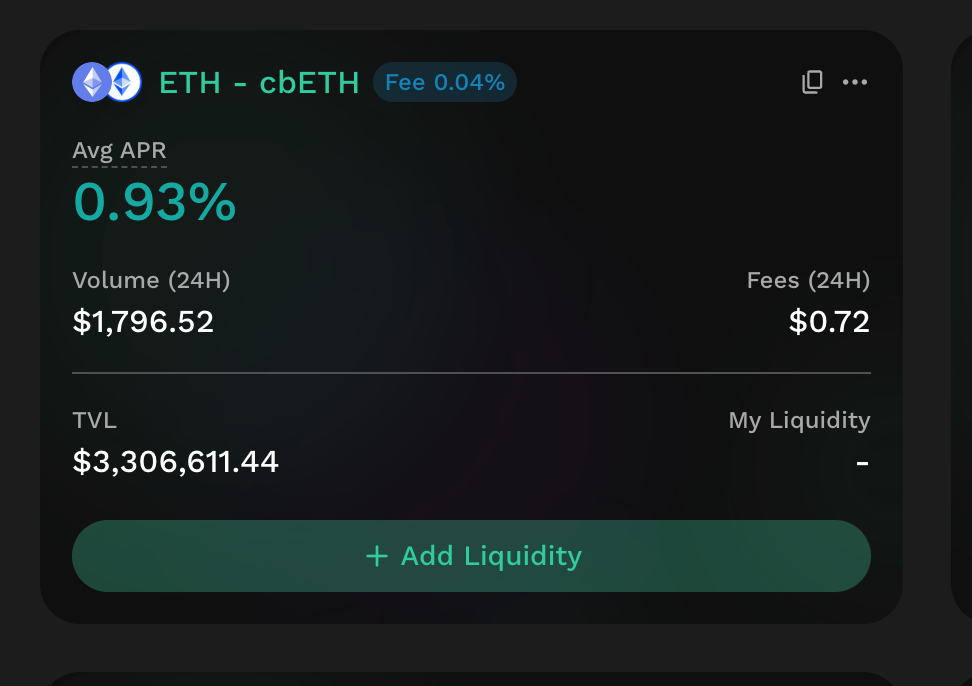
The graph presented above illustrates the balances held by cbETH token holders, and a notable observation is that approximately 96.3% of all cbETH on the Optimism Mainnet is held by Kyber Swaps contracts. This concentration of rETH within Kyber Swaps contracts is a remarkable finding, and it raises questions regarding the underlying reasons for this concentration.
One possible explanation could be the attractive yield offered by Kyber Swaps contracts. Specifically, they are providing a 0.93% Annual Percentage Rate (APR) for the ETH-cbETH vault. When compared to the APR of cbETH itself, this rate appears to be quite competitive. This could potentially incentivize users to deposit their rETH into Kyber Swaps contracts, leading to the significant concentration we observe.
Lastly I would like the show holders list for three LSD tokens together.
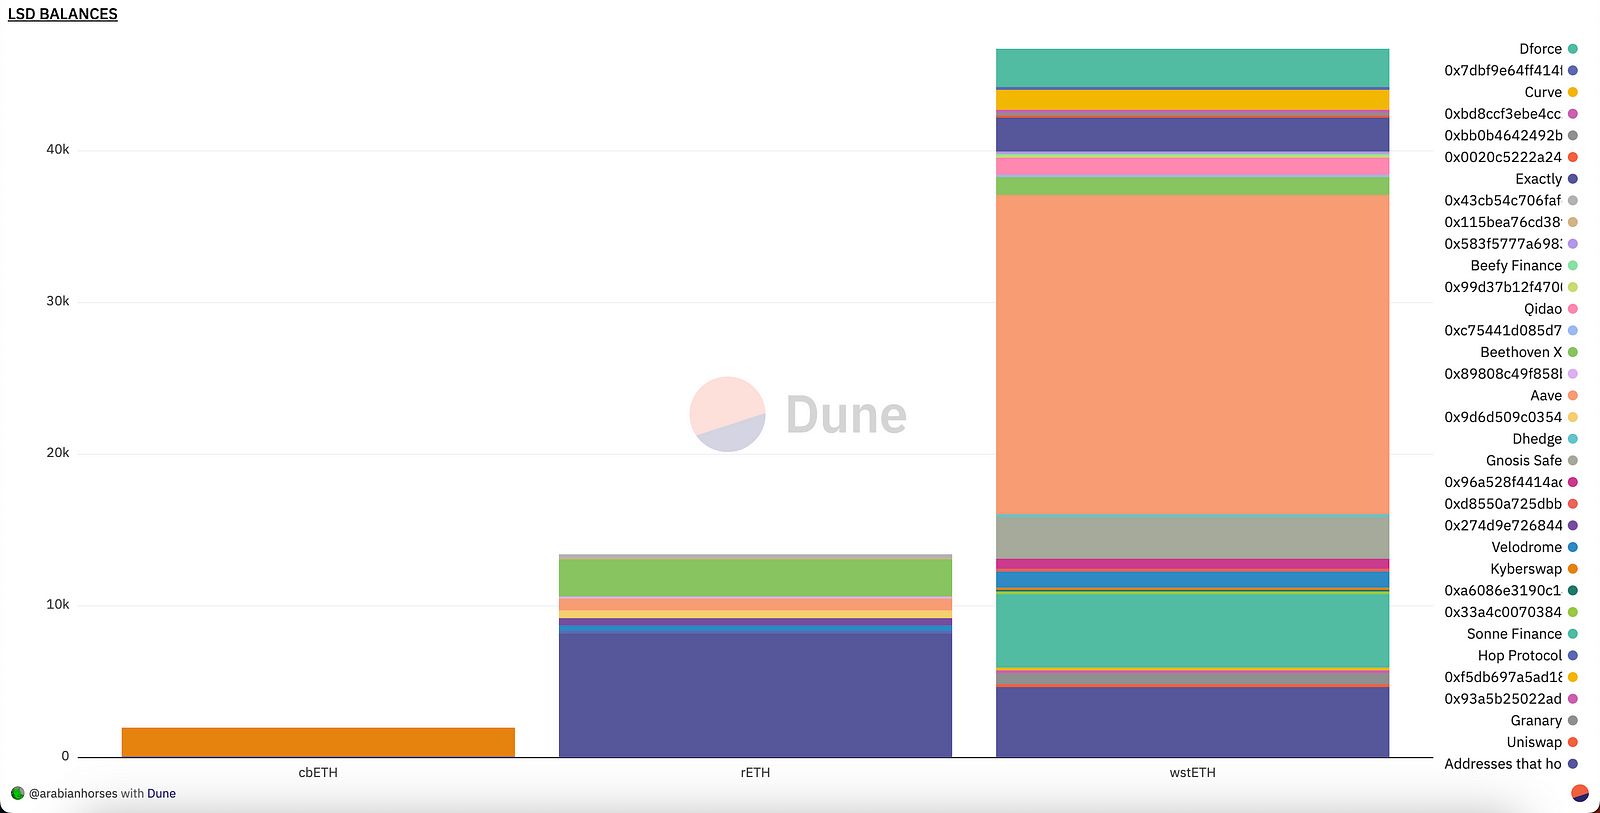
It looks like we have healthy growing on LSD ecosystem on OP Mainnet.
I hope you liked my analysis and gain some insight, all kind of feedbacks are welcome you can reach me out via discord I use same nickname in there too.