TL; DR: Wanted to share here that similar to the above S7 Grants Council impact analysis, we also explored the effects of Futarchy grants on subsequent Superchain TVL. We find that while receiving a grant shows an apparent increase in Superchain TVL after 3 months, once we account for pre-intervention TVL these prior project-specific TVL trajectories seem to be what is driving subsequent TVL growth. Sample size constraints, treatment spillover effects, and confounding variables limit our ability to make definitive causal claims here, but these suggestive insights can pave the way for improving the design and analysis in future iterations.
To recap, our main Futarchy v1 analysis asked “Do projects selected via Futarchy see a greater increase in Superchain TVL than projects selected by the Optimism Grants Council?” We find that Futarchy did identify projects with a larger Superchain TVL increase after ~3 months compared to the Grants Council, thought the effect is driven by Futarchy selecting outlier Balancer & Beets which Grants Council narrowly ranked below the selection cutoff.
A separate but related question is whether the observed increase in Superchain TVL among Futarchy-selected projects can be attributed to the grants allocated by Futarchy. Along these lines, the question presented to forecasters on Butter’s interface was “Estimate each project’s Superchain TVL increase after 84 days (Mar 20 - Jun 12 2025) if they receive 100K OP” (emphasis added).
For the analysis we used a regression discontinuity (RD) design which essentially lets us compare projects above and below the Top 5 grant selection cutoff. The Futarchy projects ranked #5 versus #6 had virtually the same expected Superchain TVL increase (a respective 0.41237 pTwap versus 0.41201 pTwap), though only the Top 5 received a 100K OP grant. If we consequently assume that projects right above and below the cutoff are otherwise similar, then treatment assignment (grant allocation) is as good as random near the cutoff.
We’re able to include daily TVL data for projects from December 20, 2024 - June 18, 2025 to increase the number of observations to 8,514. While the fundamental issue of comparing just 5 (treated) with 17 (untreated) heterogeneous projects remains, daily TVL data for each project improves the precision of the estimates within each project and controls for time-varying confounds. Using the date of actual grant deliveries as the intervention date (~2 weeks after the projects were selected due to KYC logistics), we see mixed evidence for the impact of Futarchy grant allocations on a project’s subsequent Superchain TVL.
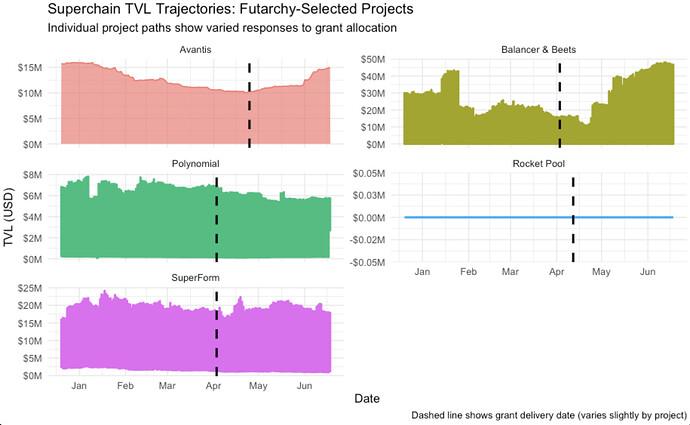
Specifically, we find that receiving a grant shows an apparent increase in Superchain TVL after 3 months, once we account for prior project-specific TVL trajectories (using pre-intervention Superchain TVL data as far back as December 2024), the apparent statistically significant effect of receiving a 100K OP grant on subsequent Superchain TVL disappears, though the sign remains positive. For reference, the individual project trends are displayed below, with individual project paths showing varied responses to grant allocation, as well as varied baseline Superchain TVL trajectories.
Let us know if there is anything else you’d like to see here! In an ongoing analysis with collaborators from the Uniswap Foundation and Emory Economics & Finance we’ll also explore a scaled measure of TVL to eliminate the influence of the market, and examine other indirect measures that Futarchy grants may have affected such as user retention and revenue.
