Optimism’s v1 experiment with Futarchy (our “Futarchy Grants Contest”) has officially concluded with the closure of Butter’s play money markets at the end of Optimism governance Season 7 on June 12, 2025. To recap, the Futarchy experiment ran parallel to a traditional Optimism Grants Council cycle, with each decision-making cohort (Futarchy and Grants Council) selecting 5 projects to each receive one 100K OP grant aimed at increasing Superchain TVL. Our overarching questions, as outlined in the initial forum post, were:
- Is Futarchy a more effective way to make grant allocation decisions than existing approaches?
- Specifically, do projects selected via Futarchy see a greater increase in Superchain TVL than projects selected by the Optimism Grants Council?
This post summarizes some of the key learnings from this first experiment with Futarchy for Collective decision-making, including descriptive forecaster participation patterns, indications of prediction accuracy of forecasters, and an observational comparison between Futarchy and Grants Council project performance based on increase in Superchain TVL 3 months after the experiment.
In a separate analysis (forthcoming as a comment to the S7 Grants Council Impact Analysis), we also share findings from a preliminary impact analysis of the effects of Futarchy grants allocation on subsequent Superchain TVL growth. While sample size constraints, treatment spillover effects, confounding variables (i.e., many other factors influencing Superchain TVL), and market volatility limit our ability to make definitive causal claims, the observational data provides interesting insights about new decision making methods and sets the stage for future iterations and learnings, in addition to the many valuable operational and product learnings from v1.
Who Participated in Futarchy v1?
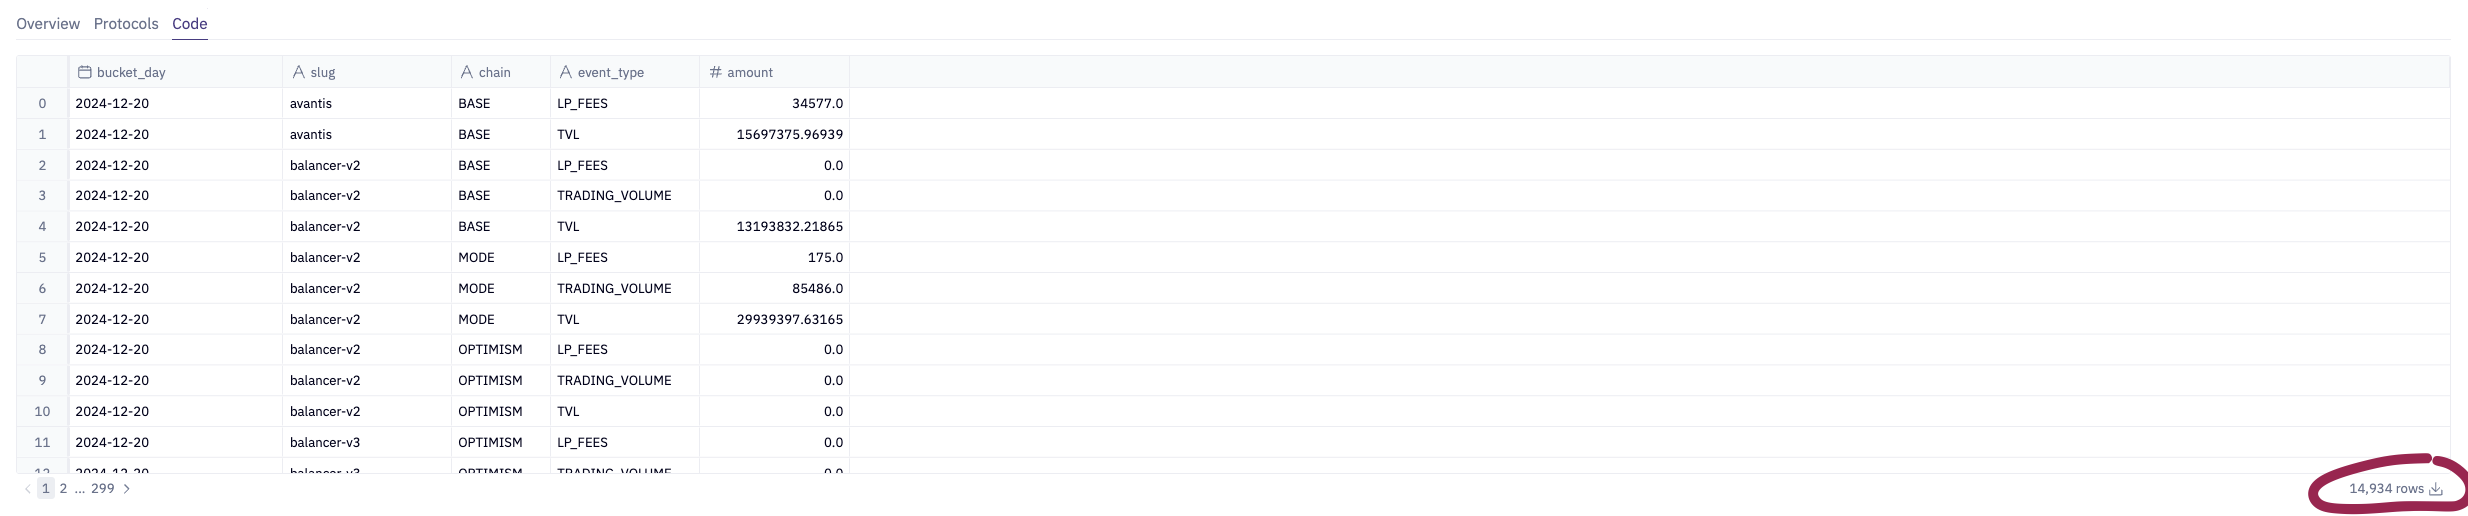
Our Futarchy experiment attracted 430 forecasters after filtering out 4,122 suspected bots from voluntary sign-ups (likely sybils proved to be a persistent challenge given the play money environment). Overall, forecasters demonstrated consistent engagement throughout the experiment, with 5,898 total trades (we will follow-up with a more granular analysis of the distribution of trades per forecasters). Unique visitors to Butter’s site spanned 10 countries (across 4 continents). New daily users ranged from 1 to 79 (average number of new users/ day was 36).

Source: Butter
Forecaster backgrounds varied significantly: 88.6% were first-time Optimism governance participants who received the baseline 50 OP-PLAY (play token) allocation, while only 11.4% were existing Optimism community members who earned additional OP-PLAY tokens through OP attestations. In contrast to what we saw, we initially anticipated that Optimism gov participants would participate at higher rates given they were eligible for a higher starting play token balance, had higher context about the Superchain-growth-focused question and metric, and had shown interest in participating in other previous governance initiatives. Based on signup information on affiliated organization, self-reported backgrounds ranged from various crypto projects or DAOs to many reporting ”none” or “unaffiliated.”
Key takeaway: We successfully attracted over 400 active and diverse forecasters, with the majority coming from outside our governance ecosystem.
Futarchy versus Grants Council Comparison
The experiment required the Futarchy contest and the Optimism Grants Council to each select 5 projects, from the same total set of 22 projects, to receive a grant. Futarchy and the Grants Council picked 2 of the same projects (Rocket Pool and SuperForm), leaving 3 unique selections for comparison.
Given that there was a max award of one 100K OP grant per project, some of the Grants Council recipients that ultimately received a grant were actually ranked outside of the initial Grants Council Top 5 ranking. For the comparative analysis, we compare the initial Top 5 selections for each group which are listed in the table below.
Futarchy Top 10 Rankings
| Rank | Project | Predicted Superchain TVL Increase after 84 days | Grant Amount Received from Futarchy |
|---|---|---|---|
| 1 | Rocket Pool | $59M | 100k OP |
| 2 | SuperForm | $48M | 100k OP |
| 3 | Balancer & Beets | $47M | 100k OP |
| 4 | Avantis | $44M | 100k OP |
| 5 | Polynomial | $41.2M | 100k OP |
| 6 | Silo | $41.2M | - |
| 7 | Extra Finance | $39.7M | - |
| 8 | Reservoir Protocol | $38.8M | - |
| 9 | Sushiswap | $37.7M | - |
| 10 | Gyroscope | $37.4M | - |
Grants Council Top 10 Rankings
| Rank | Project | Grants Council Aggregate Ranking Score | Grant Amount Received from Grants Council |
|---|---|---|---|
| 1 | Extra Finance | 34 | 100k OP |
| 2 | Rocket Pool | 27 | (100k OP from Futarchy) |
| 3 | SuperForm | 26 | (100k OP from Futarchy) |
| 4 | Gyroscope Protocol | 19 | 100k OP |
| 5 | Reservoir Protocol | 17 | 100k OP |
| 6 | Balancer & Beets | 16 | (100k OP from Futarchy) |
| 7 | QiDAO | 11 | 100k OP |
| 8 | Silo | 10 | 100k OP |
| 9 | HAI Protocol (Reflexer) | 9 | - |
| 10 | SynFuture | 7 | - |
Comparing Futarchy vs Grants Council Project Selection
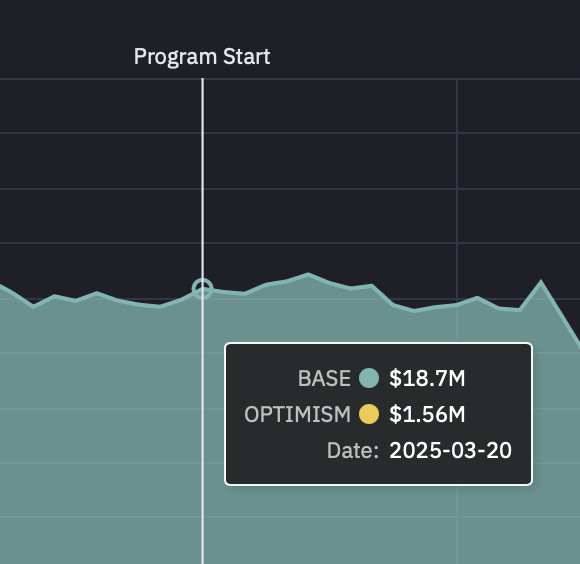
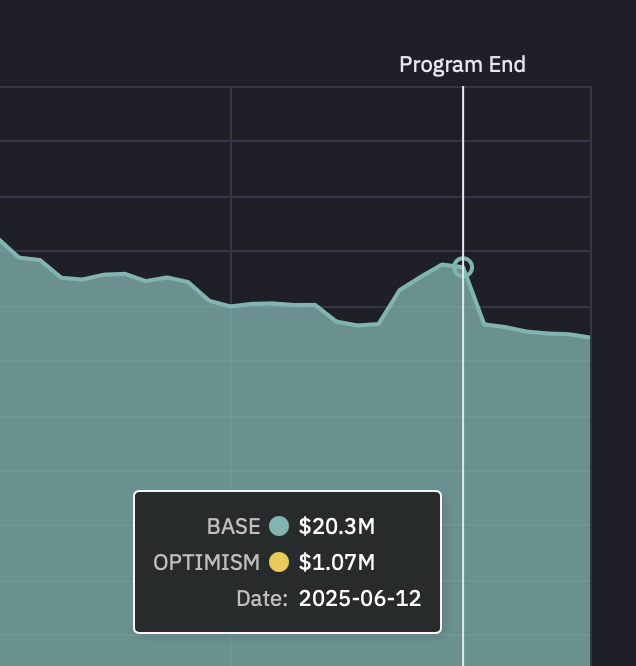
Our goal of this comparative analysis is to explore which decision-making method selected projects that saw a higher increase in Superchain TVL after ~3 months. Increase in Superchain TVL is our pre-specified outcome of interest that stems from the Optimism Season 7 intent, and the ~3 month (84 day) time period was constrained by operational launch delays pushing the start date mid-March rather than February, and needing to end by June 12 to align with the the end of Optimism Governance Season 7.
Examining Superchain TVL data, we see that the Futarchy cohort showed significantly higher aggregate TVL growth ( a difference of about $32.5 Million in TVL). This difference is driven primarily by Futarchy selecting Balancer & Beets on Base — an outlier that the Grants Council ranked 6th, narrowly missing their Top 5 cutoff by one point on their scoring rubric. Note that because the Grants Council ranked Balancer & Beets 6th (just missing the Top 5 cutoff), the margin between these decision-making mechanisms may be narrower than the raw TVL difference suggests, especially if we repeated this many times or increased the n of grant recipients. Caution should always be used when comparing very small sample sizes (3 unique projects in each group).

Source: OSO; data from DefiLlama
Another takeaway from comparing Top 10 rankings in each decision-making cohort is the fact that overall, 6/10 of the Top 10 (of 22 total projects) for each cohort overlapped, though precise ranking varied. Both Futarchy and the Grants Council ranked Rocketpool highly (first and second, respectively), which has remained at $0 Superchain TVL. It appears there was some confusion around Rocketpool’s efforts to incentivize rETH (RocketPool-staked ETH) Superchain TVL versus increasing RocketPool (the protocol) Superchain TVL.
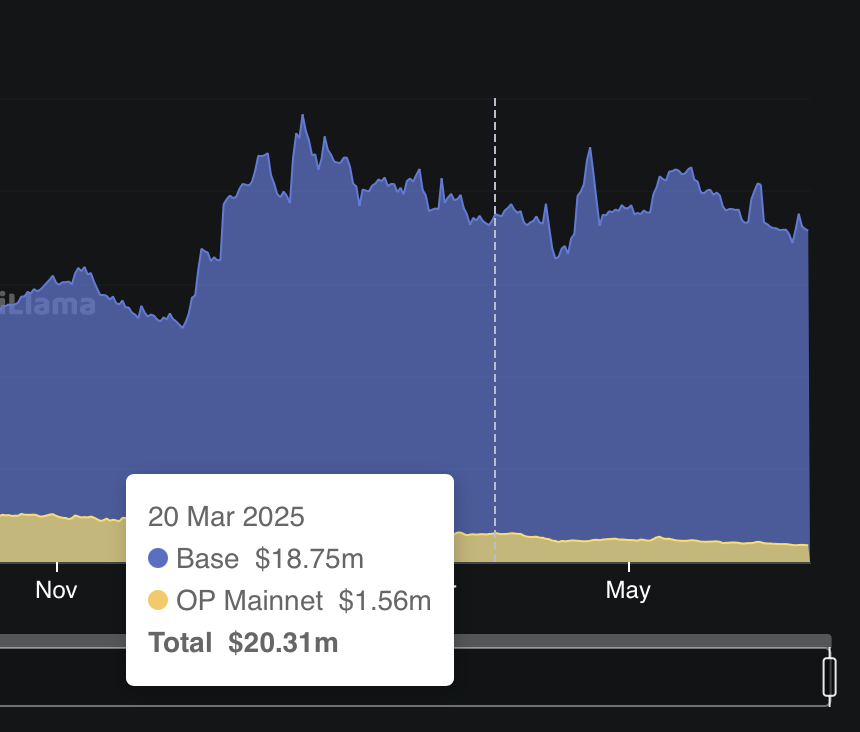
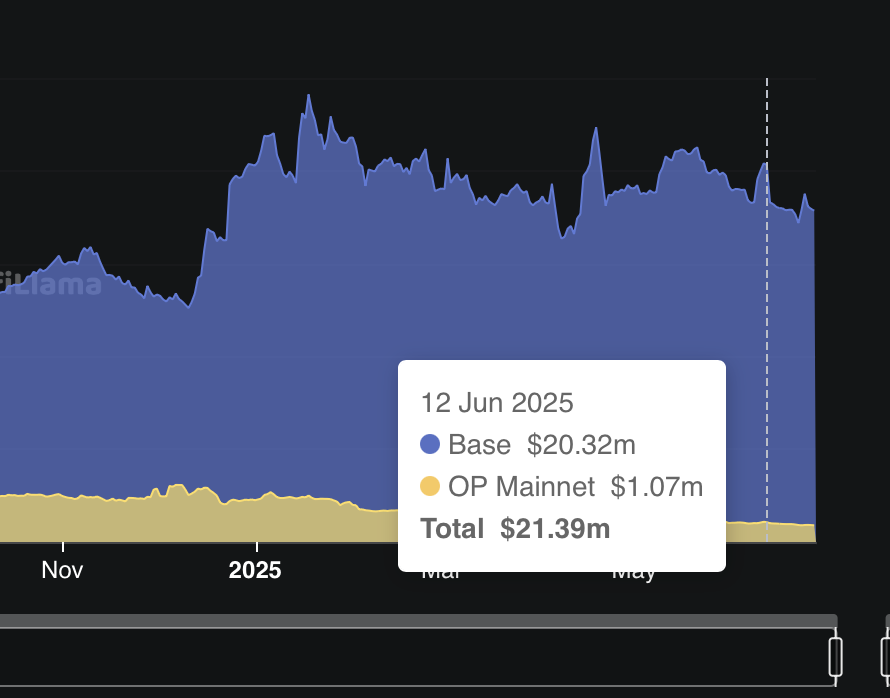
(Our definition, as displayed on Butter’s UI: Difference in 7-day trailing average TVL on Major Superchain L2s between 2025-03-20 and 2025-06-12 in USD as reported on DefiLlama. “Major Superchain L2s” are defined as: BOB, Base, Ink, Lisk, Mode, OP Mainnet, Polynomial, Soneium, Swellchain, Unichain, World Chain.)
Finally, examining TVL by chain, the increase in Superchain TVL occurred primarily on Base followed by Optimism.

Source: OSO; data from DefiLlama
The v1 data offers suggestive evidence that Futarchy at least does not select very different, or any worse (in terms of Superchain TVL increase), projects than the Grants Council.
In addition, as depicted in the above table, Futarchy demonstrated higher variance in project selection outcomes. While Futarchy successfully identified the top 2 Superchain TVL performers, it also selected the single worst-performing project out of all projects selected by Futarchy, Grants Council, or both cohorts. Grants Council showed more consistent but moderate results and selected projects that performed closer to the median, avoiding major failures while also missing top performers.
- This pattern suggests that forecasters may have been more willing to bet on high-risk, high-reward projects
- While the Grants Council committee structure may have favored lower-variance selections with more predictable outcomes.
Both mechanisms failed to identify several mid-tier winners that saw substantial TVL growth.
Access the data to dive deeper here  :
:
- OSO’s full data dashboard (h/t @Carl Cervone!)
- Butter’s comparative analysis
Note that both OSO and Butter source their data from DefiLlama, though small discrepancies in Superchain TVL increases may arise from differing date-interpolation methods and asset USD valuations at query time.
Prediction Accuracy
Another interesting data point lies in the forecaster predictions themselves, as a key goal of Futarchy is to drive more accurate information aggregation. In our play money experiment, Futarchy predictions significantly overestimated actual TVL growth across all projects. Market participants predicted substantially higher TVL increases than projects themselves estimated.This may have been due to the play money structure creating no downside risk for inflated predictions. Additionally, unlike prediction markets, decision markets allow forecasters to influence actual future outcomes — in this case, allocating multiple 100K OP grants - which may incentivize participating projects to game outcomes.
Additionally, the 50M play token initial liquidity amount may have served as an anchor that skewed predictions and impacted price discovery. Strategic voting to influence Top 5 grant allocations may have further distorted forecast accuracy. We do not have Grants Council data on predicted TVL increase amounts as this is not part of their typical assessment process.

Source: OSO; data from DefiLlama
Next steps: Improving upon v1
A key learning from v1 was that prediction accuracy was low in our Futarchy Contest. We believe future iterations could benefit from incorporating real skin-in-the-game incentives to improve the accuracy of predictions. We could also explore stronger experimental design improvements such as using an outcome metric less influenced by external forces, implementing longer evaluation periods to better asses grant impact, and expanding sample sizes for higher-powered comparisons to continue to study the differences between various decision-making structures. Specifically:
- Real skin-in-the-game incentives: Future iterations could improve forecaster accuracy by incorporating downside for inaccurate predictions (i.e., real money incentives), especially when the incentives to influence future decisions are strong.
- Forecaster quality > quantity: v2 could improve by prioritizing overall forecaster quality over quantity through enhanced sybil protection and clearer instructions and project information shared with forecasters. Real skin-in-the-game directly addresses the sybil problem and incentivizes high-quality forecasters to participate
- Stronger experimental design = higher confidence learnings: If we want to better compare decision-making structures, or answer questions about the impact of grant decisions on subsequent outcome metrics, we should design future experiments accordingly, eg
- Increase sample size
- Improve wording of the decision question
- Thoughtfully select an outcome metric that is less influenced by external factors
Wrapping this all up
Exploring our v1 Futarchy data suggests that Futarchy performs at least as well as traditional decision-making structures (i.e. the Grants Council) at identifying which projects would most increase Superchain TVL ~3 months after receiving a grant. There is suggestive evidence that Futarchy selected higher-performing projects — at least in the context of this single experiment. To recap several key takeaways:
- What Futarchy did well: Identify projects with largest Superchain TVL increase after 84 days
- What Futarchy did not do well: Accurately predict the amount that projects would increase in Superchain TVL
- Futarchy selections showed higher variance in project TVL increase than Grants Council selections.
- Please note that an impact analysis of the projects selected is part of a separate forthcoming analysis
Moving forward, given that Futarchy is a more decentralized, scalable, and transparent decision-making structure than existing alternatives, we’re interested in continuing to learn more about how and when it might make sense for the Optimism Collective to lean into Futarchy.
We believe this could make sense for decisions that:
- Benefit from the wisdom of the crowds (concave decisions)
- Need incentivized accuracy to draw out otherwise inaccessible information
- Where scalability is important
The council structure may continue to be appropriate for decisions that:
- Suffer from forced compromises among large groups of non-experts (convex decisions)
- Require a high amount of historical or Optimism specific context
- Are supported by high touch processes
Of course, a huge thank you to everyone who participated (forecasters — please take 5 mins to complete the forecaster experience survey here). While we still have much to learn about Futarchy in practice, you have helped us take a big step forward. As always, please feel free to drop any thoughts or suggestions, in the comments below ![]()
![]()