The intention behind this impact analysis is to equip the Optimism Collective with preliminary results of the Grants Council’s S8 grants and help inform OP allocation decisions in S9. It was prepared by OSO in collaboration with the Optimism Grants Council.
Summary
Season 8 TVL grants have generated approximately $3.0M in attribution-adjusted TVL uplift across the Superchain to date, from 1.8M OP distributed. This equates to a weighted ROI of $1.7 in net TVL per OP delivered (over an average observation window of ~56 days).
Overall, the program approved 6.3M OP (~$2.2M at $0.35/OP) to 23 projects targeting TVL growth across the Superchain. Projects have mobilized at least $1.6M in identifiable co-incentives, corresponding to a leverage ratio of ~0.7x on approved grant capital.
As of mid-January, 12 of 23 projects had received at least one OP disbursement (see here). These projects are included in ROI calculations. The remaining 11 of 23 projects are also being tracked for completeness but excluded from ROI metrics until their grants are delivered.
In aggregate, the intended recipients of S8 TVL grants have contributed ~$455M in unadjusted TVL growth since September 2025. Of these projects, 5 have experienced net positive TVL inflows since receiving their grant, 4 have experienced net outflows, and 4 had not yet received their first disbursement at the time of analysis.
A static version of the dashboard used to power this analysis is available here. It will be updated regularly until all grants have been fully dispersed.
Key Findings
Program-Level Results
| Metric | Value |
|---|---|
| OP Delivered to Date | 1.8M OP |
| Total OP Approved | 6.3M OP |
| Projects with TVL Data | 13 (of 23 approved) |
| Program TVL Change | +$455M (unadjusted) |
| Attributable TVL Inflows | +$3.0M |
| Attributable ROI | +$1.7 per OP |
| Average Observation Window | 56.4 days |
| Annualized ROI | +$11.0 per OP |
The annualized ROI is shown for reference only and assumes linear continuation of observed effects.
Top Performers (as of 2025-01-23)
| Project | OP Delivered | TVL Delta | Attribution | Attributable ROI |
|---|---|---|---|---|
| Truemarkets | 70K OP | +$1.68M | 20% | +$4.8/OP |
| Morpho | 600K OP | +$11.5M | 20% | +$3.8/OP |
| Hydrex | 20K OP | +$5.07M | 1% | +$2.5/OP |
| PancakeSwap | 600K OP | +$6.92M | 5% | +$0.6/OP |
Truemarkets has thus far exhibited the highest ROI per OP delivered, while Morpho and PancakeSwap account for the largest absolute TVL increases.
Project Highlights
Morpho
Morpho has thus far had the largest absolute TVL increase (+$11.5M) of projects that have received their grants.

PancakeSwap
PancakeSwap has had steady TVL growth alongside significant co-incentives (~$1.1M in CAKE).

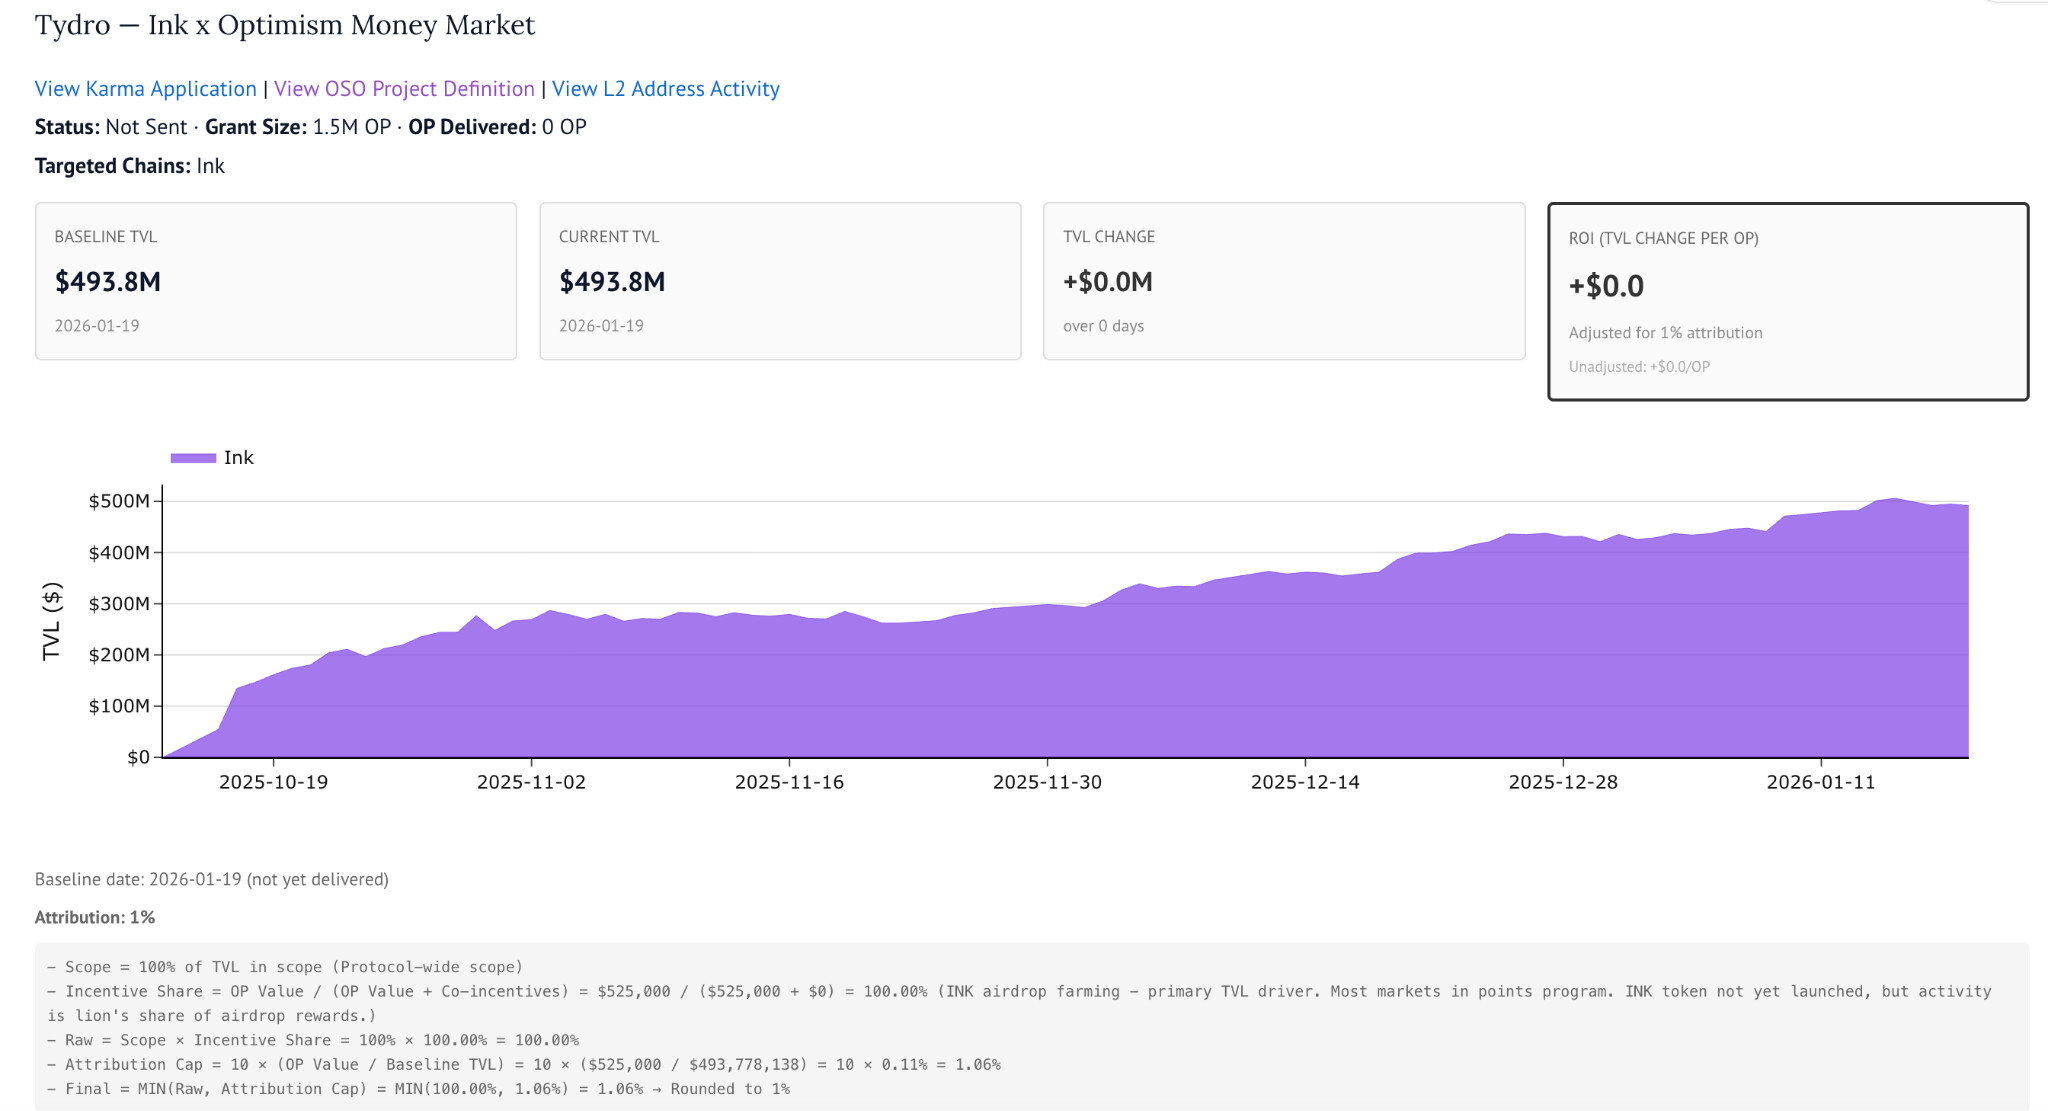
Tydro
Tydro’s grant has not yet been delivered, but protocol has accumulated ~$494M in TVL on Ink since launch in mid-October.
Co-Incentive Leverage
Across the portfolio, projects have mobilized at least $1.6M in co-incentives against $2.2M in approved grant capital, corresponding to a leverage ratio of approximately 0.73x.
When measured against delivered grants only (1.8M OP, or ~$630K), the implied leverage increases to approximately 2.6x.
This estimate is likely conservative for two reasons:
-
The $1.6M figure represents a minimum based on Grants Council desk research; actual co-incentives may be higher
-
Some programs, such as Tydro, rely heavily on points-based or token-launch incentives that are not fully captured in dollar terms
At the same time, the presence of co-incentives complicates attribution. TVL growth cannot be fully ascribed to OP grants when multiple incentive sources are active, which motivates the use of attribution adjustments in the ROI analysis.
Methodology
Baseline Measurement
Each project’s baseline TVL is computed as a 7-day average centered on the project’s baseline date. The baseline date is defined as the earlier of:
-
The reported grant start date
-
The first observed onchain OP token transfer to the project
This approach captures TVL at the earliest point at which grant-related effects could plausibly begin.
Attribution
Not all observed TVL growth is attributable to OP grants. We apply the attribution methodology proposed in the forum at the start of S8 using the following inputs:
-
Scope: the fraction of a project’s TVL that is directly targeted by the grant
-
Incentive share: the OP grant value relative to total incentives (OP plus co-incentives)
-
Cap: a ceiling based on grant size relative to baseline TVL (10x the grant-to-TVL ratio)
Final Attribution % values are rounded to standard buckets: 1%, 2%, 5%, 10%, 20%, 50%, or 100%.
Adjusted ROI
The Adjusted ROI (Unadjusted ROI × Attribution %) represents an observed (not causal) estimate of TVL change associated with the grant per unit of OP delivered.
Caveats
-
Attribution is estimated conservatively and depends on available information about scope and co-incentives
-
Market conditions are not isolated from program effects
-
Coverage is incomplete for projects without DefiLlama adapters or with TVL on unsupported chains
-
Projects that have not yet received OP disbursements show zero ROI by construction
Additional Resources
All source data is public. Key sources include:
-
Protocol-level TVL data from DefiLlama
-
Grant metadata and delivery dates from Karma
-
Onchain OP token transfers from Superchain, derived from logs
-
OSS Directory mappings between grants and DefiLlama adapters
The scope and co-incentive assumptions come from Grants Council and Foundation desk research
OSO’s complete pipeline for running the analysis is open source and fully auditable. A static (non-interactive) version of the full analysis notebook, including project-level deep dives, is available here. This dashboard will be refreshed on a regular cadence.