TL;DR:
-
SuperStacks drove $58.0M in net TVL inflows during the program, with $53.7M retained 30 days later, translating to $23.2/ OP and $21.5 / OP after costs, respectively.
-
Findings supported our theory that strong demand-side activity can lift post-incentives equilibrium levels, though a more rigorous analysis is needed.
-
Incentivized lending pools generally retained more liquidity, while DEX TVL retention appeared inflated by Uniswap’s concurrent Gauntlet campaign.
-
Overlapping incentives, external programs, and market dynamics complicated impact attribution and made it difficult to disentangle SuperStacks’s isolated effect.
Context
Marking the Foundation’s first foray into proactive DeFi incentives, SuperStacks was a pilot program designed to grow liquidity for interoperable assets across the Superchain. At its core, the goal of this program was to help interoperable assets (e.g. USD₮0) overcome the cold start problem and test new mechanisms for setting sustainable DeFi growth loops in motion. This post summarizes the key results of an extensive ROI analysis and synthesizes potential implications for future incentive programs.
Theory
To contextualize the results, we first need to introduce the theoretical framework that shaped the program’s design. We theorized that a two-pronged approach, targeting both supply- and demand-side activity, could kickstart a sustainable flywheel effect for interoperable assets on the Superchain, ultimately catalyzing lasting liquidity growth.
Specifically, we hypothesized that incentivizing TVL growth on the supply side would lead to increased trading volumes and utilization rates on the demand side. This in turn would create higher equilibrium levels for those metrics, persisting even after incentives were turned off. The proposed mechanism of action can be broken down into three phases:
-
Phase 1: Supply-Side Growth: Available incentives attract deposits into the incentivized DEX pools, which creates deeper liquidity and improves the execution quality for trades. On the lending side, an increase in lending supply reduces the borrow rate.
-
Phase 2: Demand-Side Growth: Improved trading conditions draw in more trades that get routed through the incentivized DEX pools, which increases trading volumes and generates more fees for LPs. Likewise, the more competitive borrow rates bring in more borrowers, which raises the utilization rates and generates a higher yield for lenders.
-
Phase 3: Sustainable Traction: Once incentives are switched off, a portion of the TVL and net liquidity leaves the incentivized pools, but due to higher fee and yield generation for LPs and lenders, liquidity settles at higher baseline levels compared to the pre-incentives period.
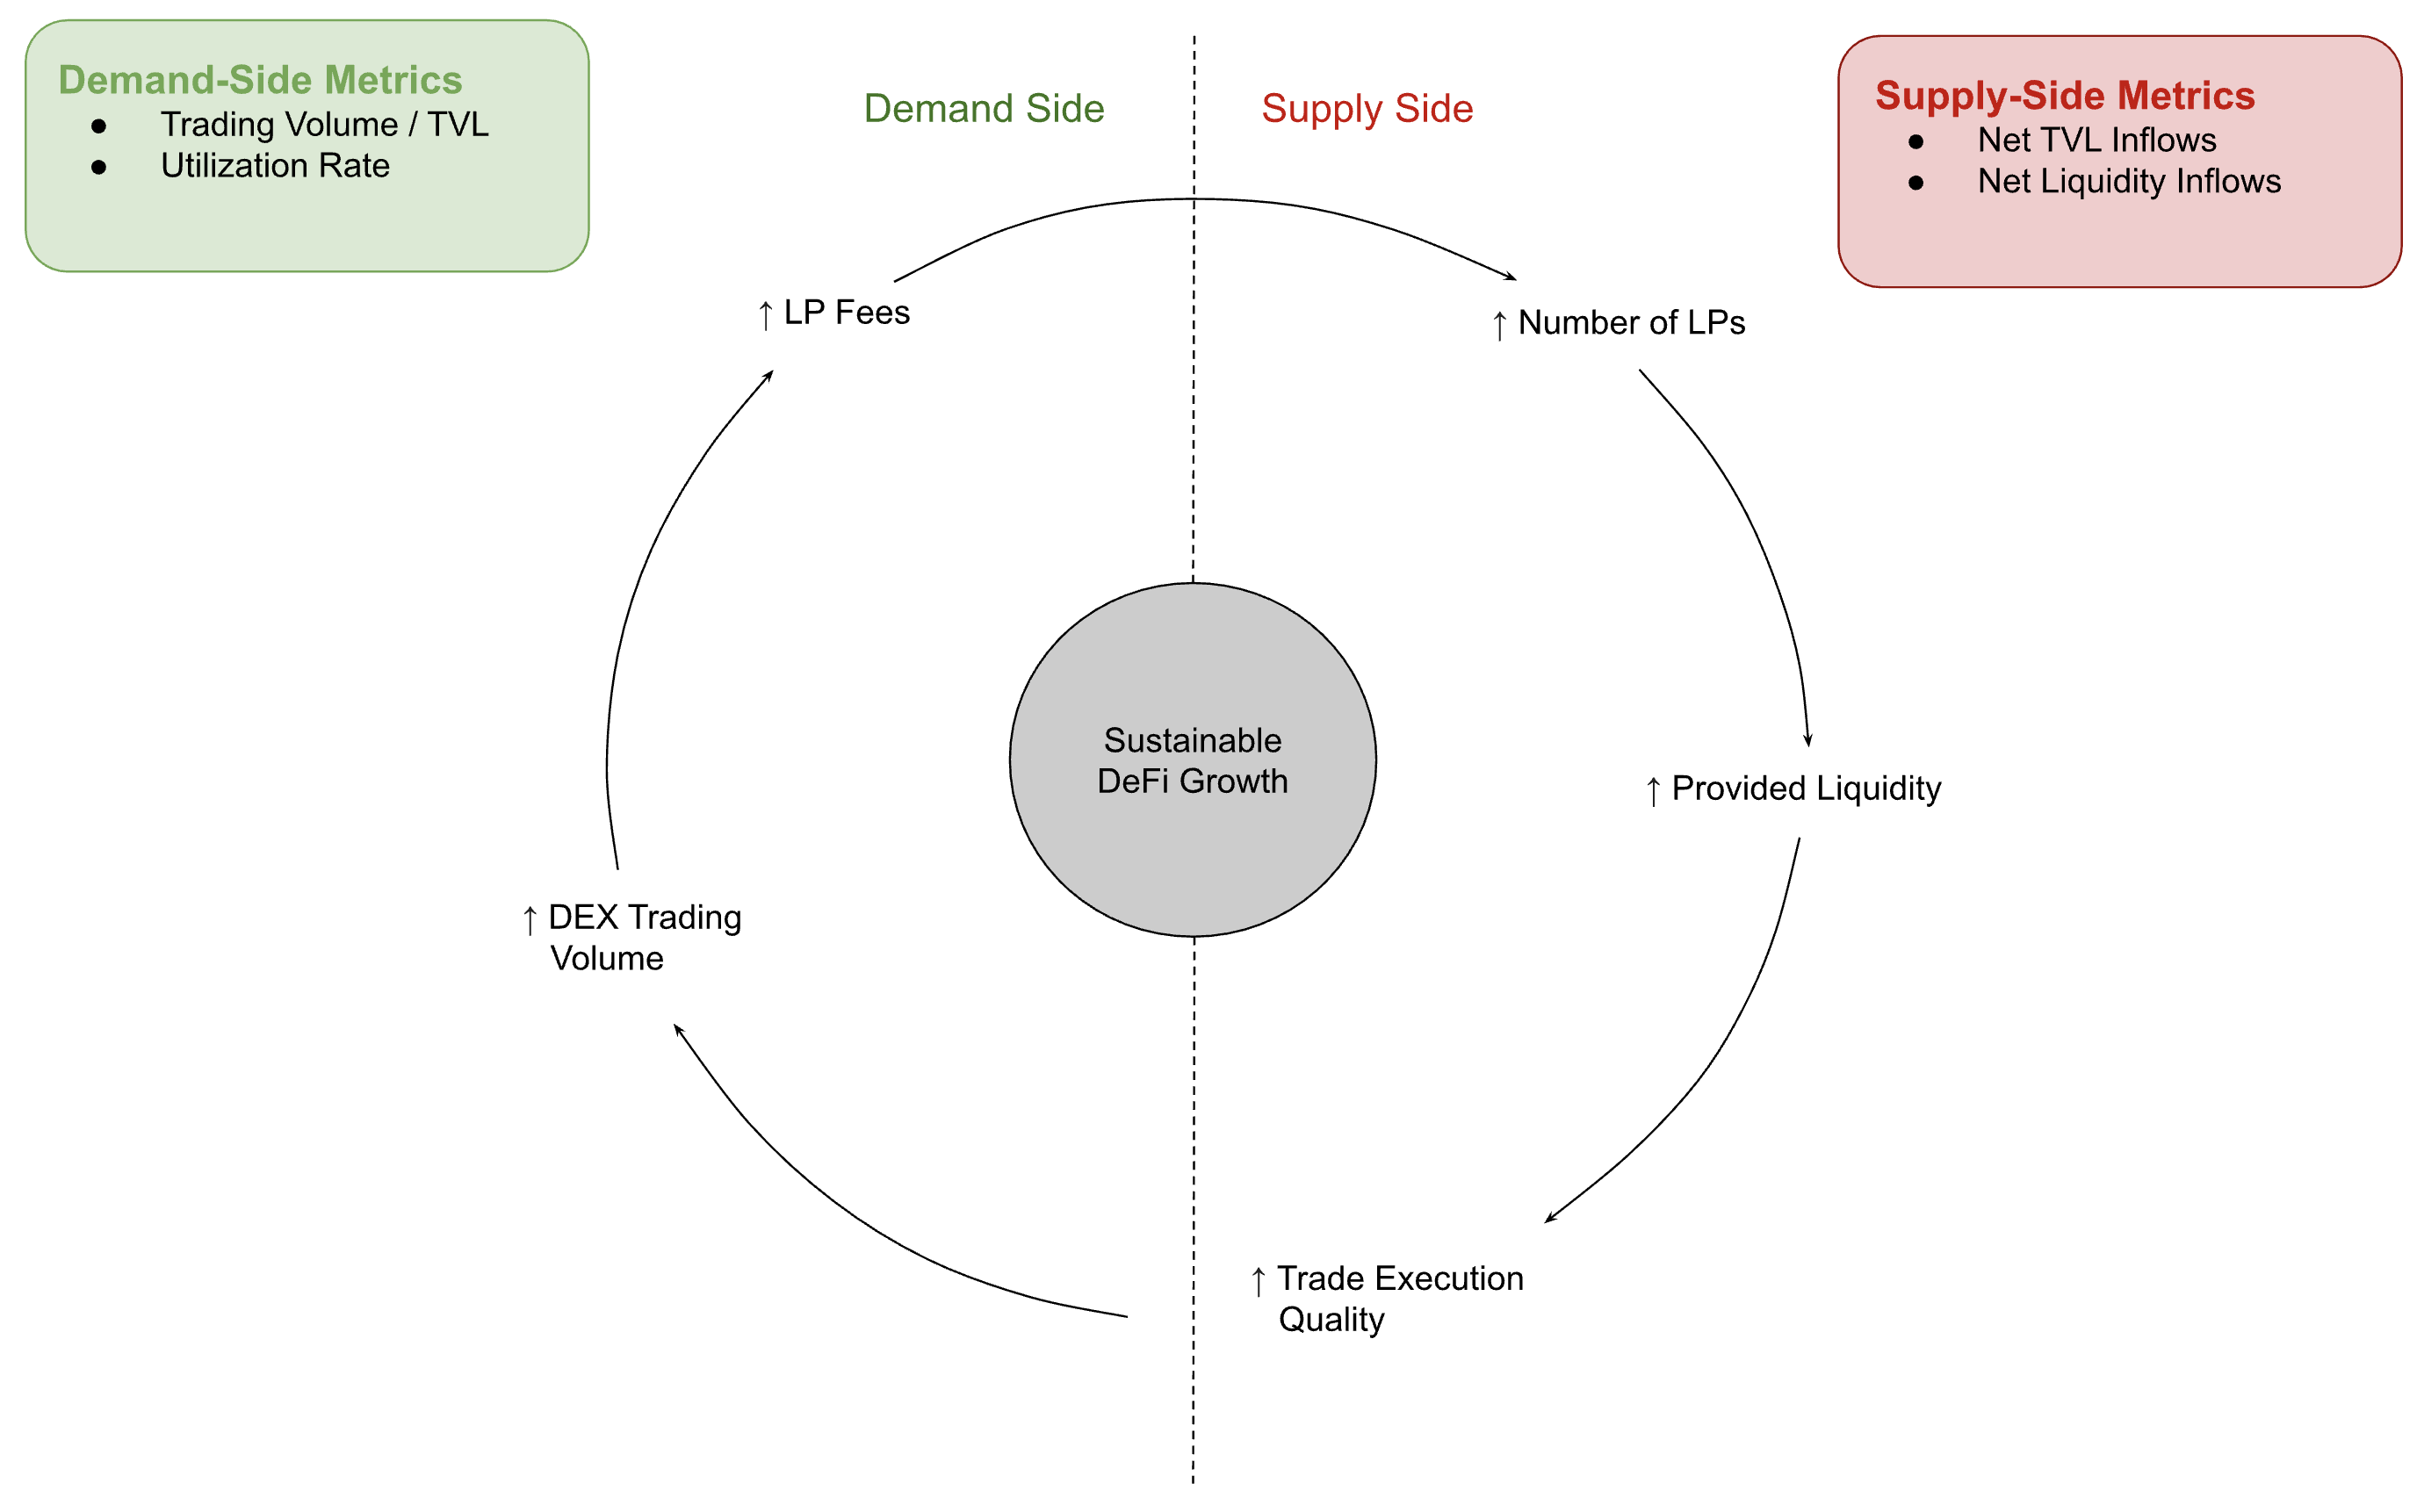
If these market forces were to play out as expected, we would anticipate a virtuous cycle to materialize during the first two phases, with a positive feedback loop emerging between rising LP fees and increasing liquidity. In the third phase, post-incentives liquidity would then be expected to find an equilibrium higher than pre-program levels.
ROI Analysis
We applied the theoretical framework to our analysis by tracking net TVL inflows during and after the program. SuperStacks spanned a 76-day incentive period, running from April 16 to June 30, which defined the measurement window for intra-program TVL acquisition. We then assessed how much of the acquired net TVL inflows were retained 30 days after the program concluded (i.e. July 30).
Notoriously fleeting and mercenary, intra-program liquidity inflows are critical for kickstarting the flywheel, but they’re only half the story. The other half is how much of that capital sticks around. For this reason, we centered the analysis on retained TVL inflows as the primary yardstick for impact. Furthermore, attribution remained a thorny issue due to overlapping incentive programs, which complicated the process of disentangling SuperStacks’s isolated effect.
In particular, the Uniswap Foundation launched its own incentive program with Gauntlet on April 15, aiming to turbocharge the nascent DeFi ecosystem on Unichain, which co-incentivized two DEX pools also included in SuperStacks (i.e. ETH/USD₮0 and ETH/weETH on Uniswap v4).
To address attribution challenges in multi-program environments, we evaluated three ROI methodologies designed to peel back the complexity of overlapping incentives. Ultimately, we adopted a prorated model to ensure consistency with other programs in the Collective.
This approach attributes impact based on each program’s share of total USD-denominated overlapping incentives, calculated using daily average token prices to normalize across different reward tokens. For example, if the Uniswap Foundation matched SuperStacks’s $100K in OP incentives for the ETH/USD₮0 pool with $100K in UNI, we would assign 50% of the resulting net TVL inflows to each program.
At a high level, SuperStacks attracted $58.0M in net TVL inflows during the program, with 31.6% coming from DEXs and 68.4% from lending markets, and retained $53.7M after the program ended. This translates to net TVL inflows of $23.2 / OP during the program and $21.5 / OP after the program.

At first glance, net TVL inflows held up remarkably well once incentives tapered off, with total unadjusted liquidity inflows across all SuperStacks-incentivized pools and vaults leveling out at an impressive $87.7M in retained TVL inflows after 30 days, while DEX liquidity barely budged. Note that the dashed vertical line in the chart below indicates the end of SuperStacks’s incentive period.

However, when the two co-incentivized DEX pools are removed, it becomes clear that this stellar performance was masked by Uniswap’s ongoing rewards program, as the Gauntlet liquidity mining campaign continued to emit rewards throughout the 30-day retention period. Without these two pools, retained TVL inflows settle at a lower $48.2M, with a gaping divergence between the lending and DEX verticals.
Meanwhile, net TVL inflows actually peaked before the end of the program, reaching $15.7M (+8.3% vs end-of-program) for DEXs and $70.0M (+55.2% vs end-of-program) for lending markets. Scaling back the aggressive XP multipliers for lending pools towards the later stages of the incentive period likely contributed to this reshuffling of liquidity.

Pool-Level Deep Dive
At a more granular level, we can tease apart the inner workings of the program by examining pool-level performance, revealing which pools underperformed and which overdelivered. To this end, we analyzed not only supply-side performance but also demand-side activity to glean observational insights about potential supply-demand interactions.
Notably, for DEX pools we used trading volume per TVL, while for lending pools we looked at the utilization rate—metrics that quantify demand-side traction and assess the “productivity” of available liquidity. From that vantage point, peak net TVL inflows for DEX pools show a moderate correlation with trading volume per TVL, hinting at possible synergistic effects. Aside from the two co-incentivized pools, USD₮0/USDT on OP Mainnet led with $7.1M in net TVL inflows but managed to retain just 7.5%.

Despite the fact that the top-performing lending pool by peak net TVL inflows exhibited a healthy utilization rate of 60.2%, the relationship between supply- and demand-side momentum was less clear-cut for lending markets than for DEXs. Overall, lending pools, and especially deposit-only vaults on Morpho, showed strong liquidity retention and, in many cases, even growth.

To further evaluate pool-level performance, we adapted the methodology from Gauntlet’s Uniswap liquidity mining analysis and applied it to SuperStacks. More precisely, each incentivized pool (treatment) was paired with a comparable, unincentivized pool (control) on the same chain and protocol, and one-sided t-tests were run to test for statistically significant changes in TVL and trading volume during and after the incentive period.
From the total of 25 incentivized pools and vaults, we focused exclusively on DEXs to ensure comparability, excluding all 7 lending pools and vaults. Of the 18 DEX pools, 9 were removed either because they were co-incentivized or because no suitable control pool was available (e.g. low TVL, low volume, or insufficient time series data). The remaining 9 treatment-control pairs are shown below.
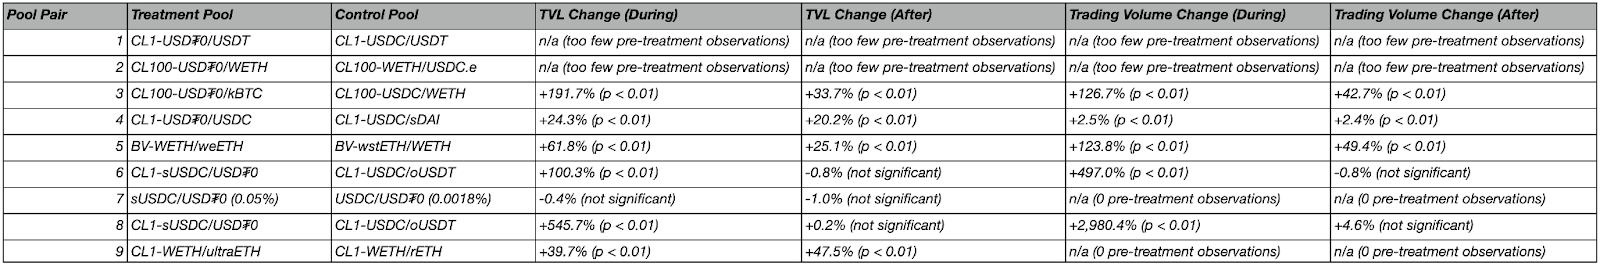
Among the pools that passed our statistical filters, CL100-USD₮0/kBTC on OP Mainnet stood out with one of the strongest responses. TVL grew rapidly during the incentive period (+191.7%) and remained significantly above baseline after incentives ended (+33.7%, p < 0.01), while trading volume rose 126.7% during and 42.7% after (p < 0.01).

A similar pattern was observed in CL1-USD₮0/USDC on OP Mainnet, though to a lesser extent. TVL rose 24.3% during the program and stayed elevated afterward (+20.2%, p < 0.01), while the effect on trading volume was more muted over the short term (+2.5%) but picked up after incentives concluded, settling at 25.1% above baseline (p < 0.01).

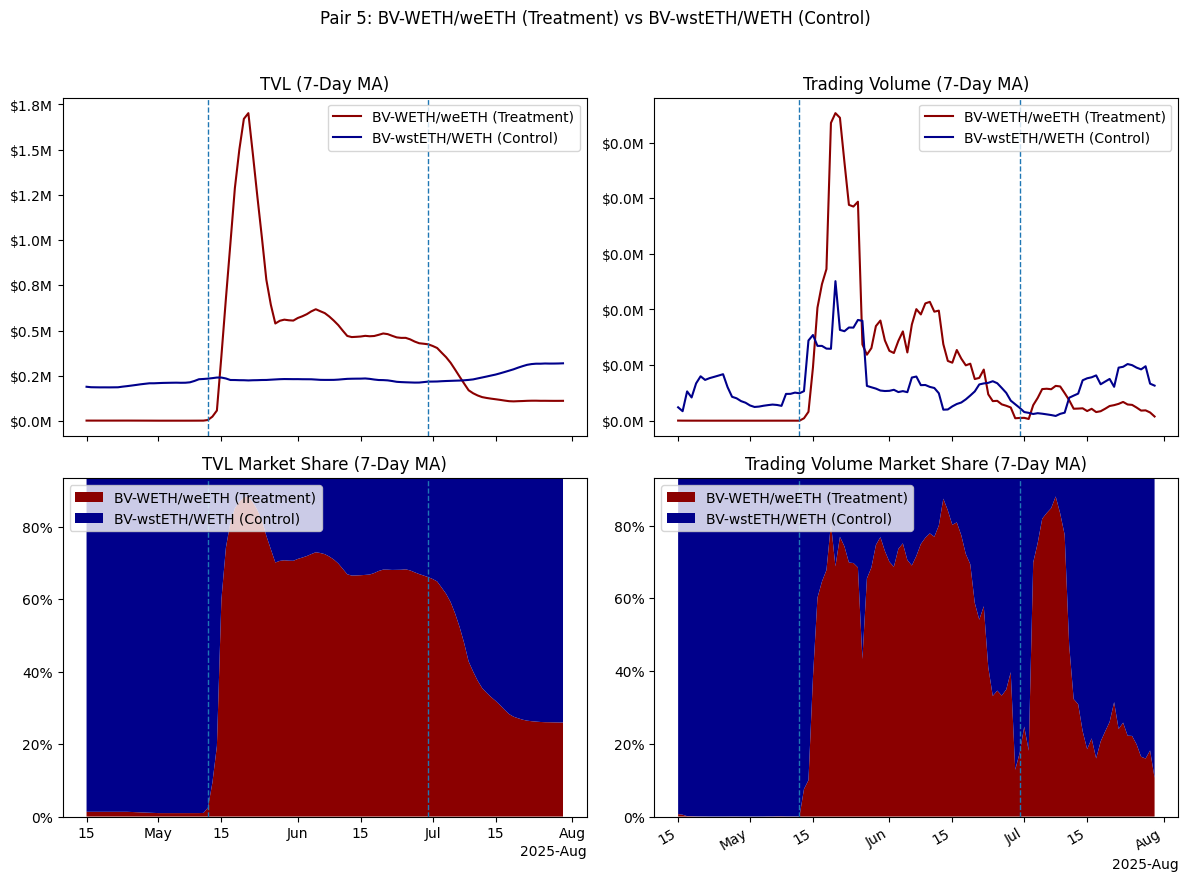
Lastly, BV-WETH/weETH on OP Mainnet showed strong evidence of enduring impact. TVL grew 61.8% during and remained 25.1% higher after the program (p < 0.01). On top of this, the increase in trading volume was even more pronounced, with a lift of 123.8% during and 49.4% after (p < 0.01).
Limitations
While the ROI analysis provides useful directional insights, several limitations are worth acknowledging. First, isolating the causal effect of SuperStacks is nearly impossible given the vast sea of confounding variables, such as external co-incentives and broader market volatility. Relatedly, the control pool selection for t-tests likely suffers from bias, as there are non-random differences between the treatment and control pools that may also be driving changes in the outcome.
Moreover, cannibalization between treatment and control pools is another potential source of skew, as liquidity may have shifted from one to the other during the incentive period. Finally, some pools were created just before incentives were switched on, which skews the pre-treatment baseline and complicates before-and-after comparisons.
Conclusion
All things considered, SuperStacks attracted a meaningful amount of net TVL inflows, with lending markets in particular showing stronger retention than DEXs. At first glance, DEX liquidity retention appeared impressive, but closer inspection revealed that much of this performance was driven by Gauntlet’s co-incentivized pools. Lending pools fared better, but their striking TVL retention might have been bolstered by unknown external factors that came into play after SuperStacks ended.
What’s more, trading volume per TVL emerged as a potential predictor of net TVL inflows, but its explanatory power was inconsistent and requires a more rigorous analysis. Additionally, the prevalence of overlapping incentive programs underscores the difficulty of attributing impact, as co-incentives make it nearly impossible to perfectly isolate the treatment effect.