After reviewing all the RetroPGF 3 discussions, @ccerv1 and I collaborated on a simulator to analyze a few questions around the quorum-median model and enable badgeholders to further explore their questions and ideas.
This is a two-part post. In this first part, we describe the “quorum-median” model + general goals and assumptions, introduce a simulator, and using the simulator with placeholder-data, attempt to answer a few questions raised by the OP Collective. The second post, coming in January, will explore collusion and lists when the complete dataset is released.
Let’s start with laying out the “quorum-median” Round 3 model:
Round 3 Model:
- Simple quorum of 17 votes + median of amounts allocated per project
- Lists created by badgeholders containing projects with suggested allocation distribution.
More details: Round 3 Design post and Badgeholder’s Manual, and V1 of results calculation.
An Ideal Model Would Solve For:
- Preventing badgeholder collusion (creating a threshold of requiring more voters to impact results).
- Projects with fewer ballots are not penalized and reduces a popularity contest. Smaller/independent projects should have equal chance of being reviewed/rewarded for their impact.
- Final allocation is closest to fill the gap of “impact = profit”, which means not more or less.
- Reducing the “metagame” that badgeholders engage in (making adjustments based on what they think others will do).
Assumptions:
- Badgeholders should try to allocate the amount that fills the gap “impact = profit”
- Every badgeholder is not reviewing/voting for every project.
- Each badgeholder has 30M OP to allocate, but does not have to deploy the full amount.
- A 0 ballot should not be the same as an abstain/happy to go with majority’s decision ballot. An “abstain” ballot confirms review / approves project for quorum, but doesn’t indicate a specific allocation amount to be counted as part of the median.
- A project must meet a minimum of 1,500 OP to be funded. Therefore an abstain ballot means the project should be funded, but more than 1,500 OP.
- A project can reach quorum and have 0 OP allocated.
There were a few discussions around the downsides of a quorum+median model, such as a “meta-game” (certain intentional or unintentional choices bringing down a project’s median) and the irony of quorum collusion. This left us with a few questions we wanted to answer through simulations.
Simulation
Carl created a model that allows you to simulate different round assumptions. It’s not very sophisticated, but should allow some experimentation around scoring algorithms.
Initializing the model
First, initiate the round by setting the max funding equal to 30M tokens.
simulation.initialize_round(
    max_funding=30_000_000
)
Then, generate a random set of projects.
simulation.randomize_projects(
		num_projects=643
)
When projects are generated, they are assigned an impact rating. Impact ratings are distributed randomly along a simple bell curve.
Finally, generate a random set of voters.
simulation.randomize_voters(
    num_voters=150,
    willingness_to_spend=1.0,
    laziness_factor=0.5,
    expertise_factor=0.5
)
This function initializes a set of 150 voters with the following properties determined at random:
- The voter’s
willingness to spendup to the maximum amount. A value of 0.5 would mean that some voters will only spend up to 15M tokens. - The voter’s
lazinesswhen it comes to reviewing all of the projects. The higher the value, the fewer projects the average voter will include in their ballot. A value of 0.5 means that voters will select up to 50% of the projects in the pool. - The voter’s
expertisewhen it comes to identifying high impact projects. The higher the value, the more likely it is that the voter is making good choices and not just selecting randomly. A value of 0.5 means that voters will be in a calibration range of 50-150% of a project’s trueimpact rating.
The higher these three values are, the more likely it is that voters will deliver a very skewed allocation result, rewarding only a small number of high impact projects.
The model has some scaffolding to map relationships between voters and projects and model collusion among voters, but this hasn’t been implemented yet.
Running a simulation
When a simulation is run, each voter effectively “scores” each project. The score is the product of their expertise (randomized within a range) and the project’s true impact rating. The scores are sorted and the bottom ones are thrown out based on the voter’s laziness. The voter iterates through each project and casts a vote. The vote itself is also a random number, between the min funding amount and a max variable that is set based on max funding and the total number of projects the voter is willing to consider. The max the voter is willing to give to any project decays after each vote. This continues until the voter runs out of money.
Once all votes are complete, the simulation calculates the appropriate allocation to each project based on different scoring formulas, eg:
simulation.simulate_voting_and_scoring(
    n=1,
    scoring_method='median',
    quorum=17,
    min_amount=1500,
    normalize=True
)
The variable n represents how many times to run the Monte Carlo simulation in order to get a reasonable sense of the distribution patterns. The other variables include several variants of the scoring method (median, mean, simple quadratic funding, and Ricmoo’s “outlier” method), a quorum threshold, a min_amount per project threshold, and whether to normalize the results pro rata to allocate the entire pool of funding (ie, 30M OP). These are effectively all of the scoring inputs that voters were presented to voters and projects prior to the start of the round.
Base case
We’ll use the settings above as our base case.
Here are the outputs of the model.
scoring_method               median
vote_quorum                      17
min_amount                     1500
normalize                      True

num_projects_above_quorum       451
avg_payout                    66507
median_payout                 35367
max_payout                   439910
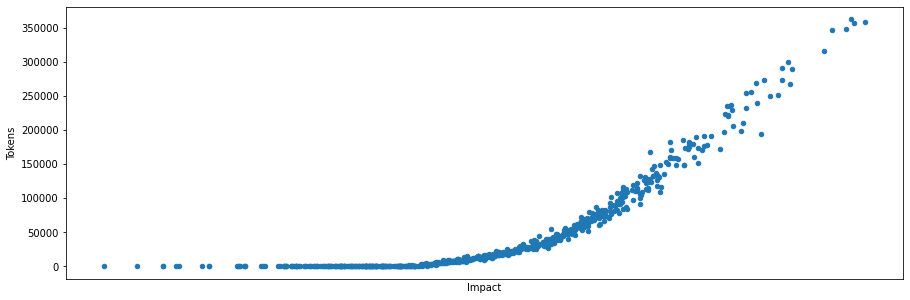
This is what the overall distribution curve looks like.

And we can see decent correlation between “impact” and tokens awarded (ie, “profit”).
“Quorum-Median” Model Questions
Using placeholder data, we used this simulator to answer a few questions raised by badgeholders. We explored the impact around these factors:
- Total OP distribution amount
- Number of projects reviewed
- Quorum minimum
- 0 ballots
- Different models (ie. mean, quadratic formula)
The questions below are based on the quorum-median model as default. Our analysis:
-
Each badgeholder had $30M OP to distribute. We did not have to deploy all of the funds. What is the impact if badgeholders deploy all of the $30M vs less?
A. No impact.
We can model this by setting
willingness to spendto 0.5 instead of 1.0. The implication on the model is that voters will use somewhere between 15M to 30M tokens, instead of everyone allocating 30M. (The actual willingness to spend is distributed randomly.) We’ve kept everything else including the scoring methodology the same.scoring_method median vote_quorum 17 min_amount 1500 normalize True num_projects_above_quorum 459 avg_payout 65320 median_payout 35258 max_payout 434964This is not surprising given that the results are still normalized to the full 30M and the
willingness to spendbehavior is distributed randomly across the voter population. -
There were 645 projects to review, but badgeholders were not expected to review all of them. There was no set consistent nor minimum or maximum of projects per badgeholder to review. What is the impact if badgeholders review lots of projects?
A. High impact.
We can model this by setting
lazinessto 0.1 instead of 0.5. This means the average badgeholder is doing more work and considering more projects, even if it means giving out very small allocations. (The actual number of projects reviewed is distributed randomly.) Everything else is kept the same.In our simulation, the number of projects above quorum increased significantly compared to the baseline. Consequently, the average payout was reduced. This had more impact on strong performing projects, cutting the max payout nearly in half. The median payout increased slightly.
scoring_method median vote_quorum 17 min_amount 1500 normalize True num_projects_above_quorum 613 (++) avg_payout 48883 (--) median_payout 37662 (+) max_payout 242175 (--) -
A project must meet a minimum of 1,500 OP to be funded. What is the impact of a 1,500 OP minimum?
A. Low impact.
We can model this by removing the
min amount. This has the effect of including another ~5% of projects on the right side of the tail, and thereby lowering the average, median, and max payout across all projects.scoring_method median vote_quorum 17 **min_amount 1** normalize True num_projects_above_quorum 478 (+) avg_payout 62711 (-) median_payout 32509 (-) max_payout 393434 (-) -
Round 3 utilizes a median calculation. Keeping the quorum requirement the same, what is the impact of running the mean on the same dataset? What about Quadratic funding?
A. Medium impact.
Running the mean instead of the median brought more projects above quorum, reduced the max payout, and brought the median amount up. It resulted in a smoother distribution curve too.
**scoring_method                 mean**
vote_quorum                      17
min_amount                     1500
normalize                      True

num_projects_above_quorum       480 (+)
avg_payout                    62398 (-)
median_payout                 37786 (+)
max_payout                   347658 (--)

The quadratic funding model produced a very different distribution, with a much higher median but the top project receiving much less as well. This could be a good scoring method for rewarding a plurality of high impact projects and avoiding an overly long tail.
```
**scoring_method               quadratic**
vote_quorum                         17
min_amount                        1500
normalize                         True

num_projects_above_quorum          454
avg_payout                       66012
median_payout                    42259 (++)
max_payout                      338246 (--)
```

-
A project needed a quorum of 17 votes. What is the impact of a higher quorum of 34 votes?
A. High impact.
We can model this by increasing the
quorumthreshold from 17 to 34. This has the effect of significantly reducing the number of projects on the right side of the tail, and thereby increasing the average and median payout. The effect on the max payout, however, is less pronounced.scoring_method median vote_quorum 34 min_amount 1500 normalize True num_projects_above_quorum 311 (--) avg_payout 96471 (++) median_payout 63710 (++) max_payout 454424 (+) -
Badgeholders had the choice to “abstain” by not voting (which expresses indifference as to how much OP a project should receive) or vote with a ballot of 0 OP distribution (”0 ballot”). Assuming the project meets quorum, what is the impact of a 0 ballot on a project?
A. A zero has the effect of canceling out a projects highest vote, thus they have a greater impact (in absolute terms) on projects that are more popular / receive higher token votes.
For instance, we can model a project with 75 votes and a base award of 150K OP. With one zero, its payout drops to 147K and with three zeroes it drops to 139K. Each zero has the impact of reducing a popular project’s allocation by about 2-3K.
If we model a hypothetical project with 15 votes and a median of 3677 OP, then getting two zeroes pushes it over quorum to 3510 OP. Even with 10 zeroes (out 25 total), the project remained above quorum. Each zero reduced its allocation by only 160 OP.
Finally, if we look at a project with 55 votes and a less normal distribution, the first zero has an impact of 9K OP and the second another 9K OP. In this case, the project would have received 75K OP with 55 votes (and no zeroes) and 57K OP with 57 votes (including two zeroes), making the zeros a very hefty penalty.
Conclusion
These are starting points for the OP Collective to gather insights. We hope you will use this simulation to play with your own models and questions. We’d love to hear about your results and if you have any comments or questions, please leave a comment below!