Following up on our previous post, “RetroPGF/RF Evolution & Numbers,” where we broke down the themes, allocations, and key recipients across each round, we’re back with a deeper dive. In this post, we’re taking a closer, data-driven look at how participation and OP distribution have evolved from Rounds 1 through 7, exploring who took part, how categories and volumes have shifted, and how rewards were allocated.
This analysis comes from the Lampros DAO team as part of our broader effort to surface meaningful, data-driven insights for the Optimism community.
Introduction
Retroactive Public Goods Funding (RetroPGF), now called Retro Funding (RF), is a funding approach that rewards projects and contributors who have created lasting value for the ecosystem. Instead of funding work in advance, it allocates rewards after impact has been proven, enabling the community to recognize and support meaningful contributions.
Since its launch, RetroPGF has gone through seven funding rounds, each with its own focus, scale, and selection process. Over time, these rounds have seen changes in who participates, the size of funding pools, and how rewards are distributed.
The thematic focus for each round was:
-
Round 1: Early Optimistic Ethereum Contributors
-
Round 2: OP Stack
-
Round 3: OP Stack, Collective Governance, Developer Ecosystem, End User Experience & Adoption
-
Round 4: Onchain Builders
-
Round 5: OP Stack Contributors
-
Round 6: Governance Contributors
-
Round 7: Onchain Builders + Developer Tooling
This analysis reviews all seven rounds to understand how the program has evolved, looking at participation trends, shifts in project categories, and patterns in OP reward allocation. The goal is to highlight what these changes reveal about the priorities and decision-making of the Citizens’ House.
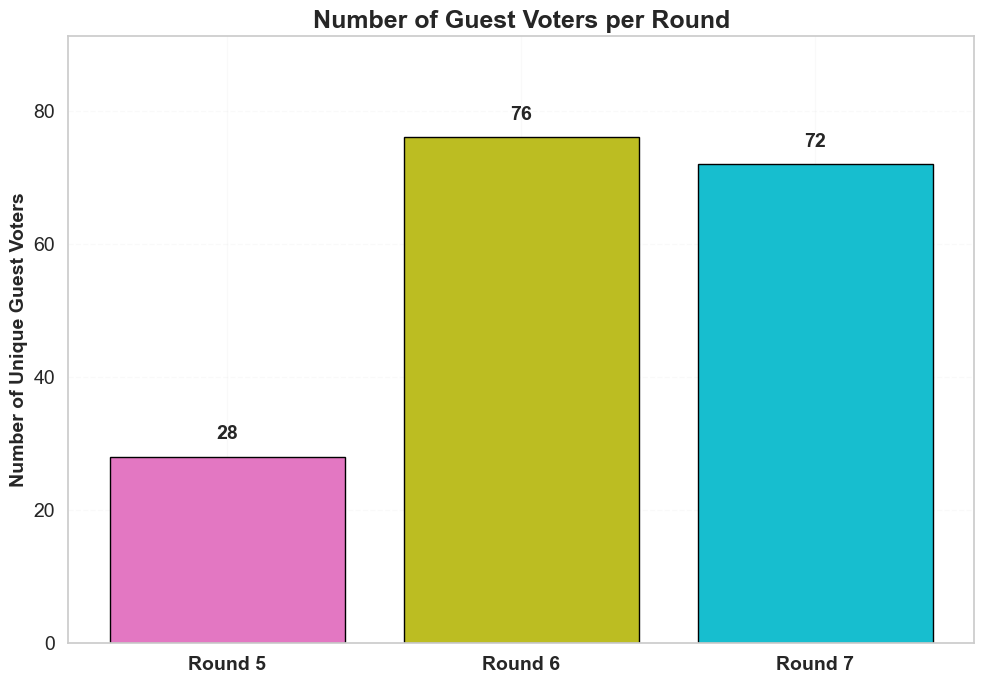
Guest Voters: Rotation, Scale, and Impact
Guest voters were first introduced in RPGF/RF Round 5 as part of an effort to expand and diversify decision-making within the Citizens’ House. They are individuals temporarily invited to take part in the allocation process. Unlike permanent badgeholders, guest voters serve only for specific rounds. This approach is meant to bring in fresh perspectives, increase representation, and reinforce the decentralized nature of governance.
Per Round Guest Voter Count
-
Guest voters were present in Rounds 5, 6, and 7, but the number varied each time.
-
There were no individuals who participated as guest voters in all three rounds.
Consistency and Rotation
This zero overlap shows that the Foundation intentionally rotated the selection to avoid entrenchment. The process was randomized to ensure each round brought in different voices, maintaining openness and experimentation in decision-making.
Overlapping vs Unique Guest Voters

-
Most guest voters participated in only one round.
-
Round 7 saw the largest group of unique participants, hinting at a growing contributor pool.
Badgeholder Participation Analysis
Badgeholders are representatives of the Citizens’ House who review applications and allocate OP rewards based on impact. Their evaluations directly determine how funds are distributed in each RetroPGF round.
Long-Term Citizens
Seventeen badgeholders have participated in all seven rounds, showing strong continuity and commitment within the Citizens’ House.
Badgeholder Count per Round
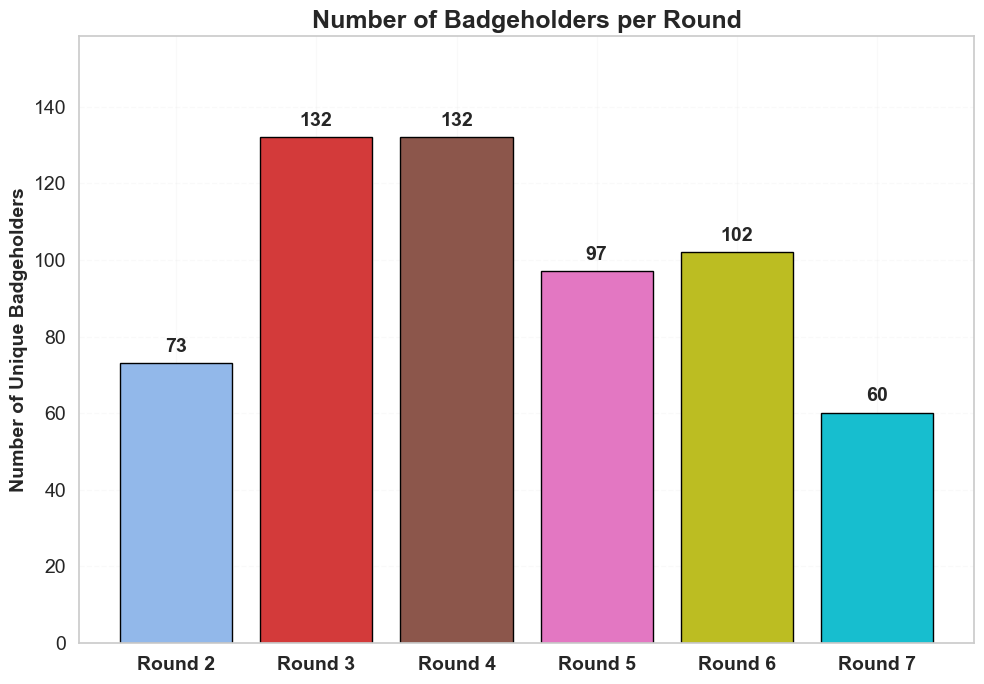
Participation levels have varied across rounds. The highest numbers were recorded in Rounds 3 and 4, with 132 badgeholders each, marking the peak of engagement. In contrast, Round 7 saw the lowest participation, with only 60 badgeholders.
The trend shows early growth from Round 2 (73 badgeholders) to Rounds 3 and 4, followed by a gradual decline in later rounds.
Overlapping vs Unique Badgeholders
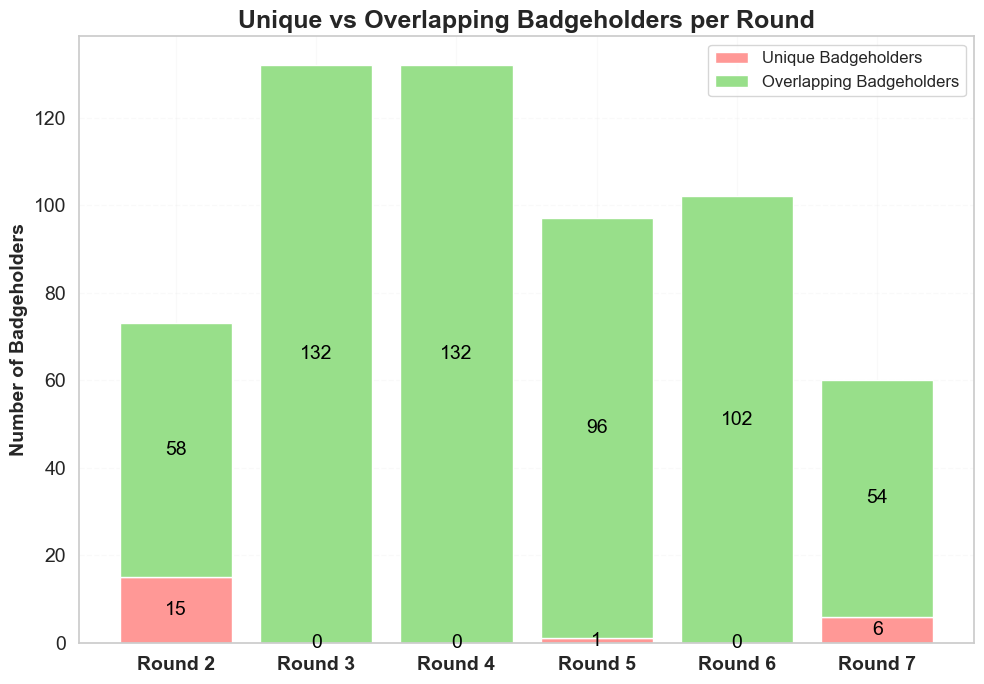
Analysis of participant overlap shows that most badgeholders returned for multiple rounds, forming a core group of trusted evaluators.
-
Round 2 had 15 unique badgeholders, likely because it was the first round with identifiable participants.
-
Rounds 3, 4, and 6 had no unique badgeholders, meaning all participants had been involved previously.
-
Round 7 brought in 6 new badgeholders, showing a small effort to refresh the evaluator pool.
In Round 6, the presence of guest voters reduced the need for badgeholder replacement.
New vs Recurring Badgeholders
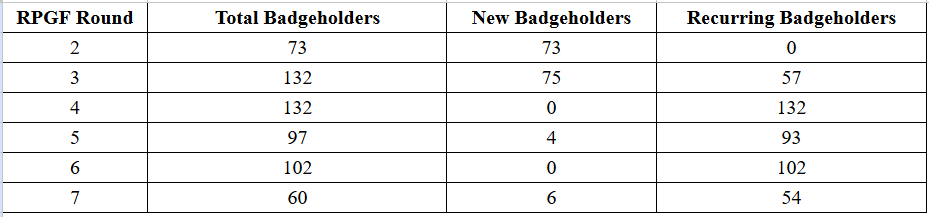
In Round 2, all Badgeholders were new. Round 3 saw the largest intake of newcomers with 75 first-time participants. From Round 4 onwards, onboarding of new members declined sharply. Rounds 4 and 6 had no new entries, while Rounds 5 and 7 introduced only a handful of fresh participants. This pattern suggests increasing reliance on an established group of evaluators and limited integration of new voices over time.
Project Participation Analysis
The Optimism RPGF/RF rounds have seen varying levels of project interest and funding patterns over time. This section looks at how many projects applied, how many received funding, and how participation evolved across the rounds.
Total Applications per Round
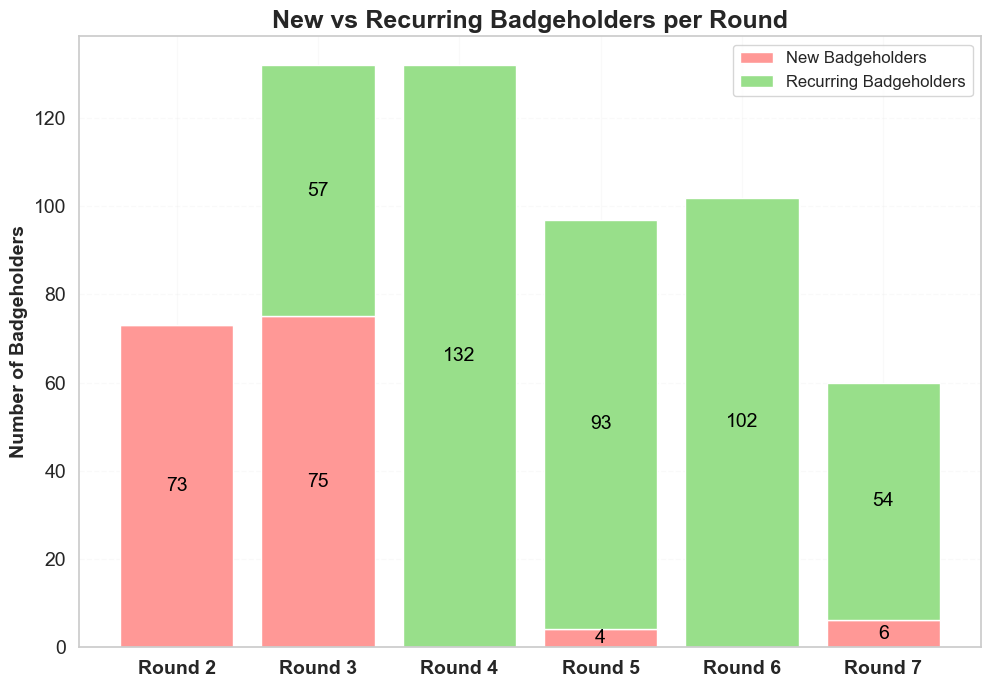
In terms of applications, Round 3 was the busiest with 643 submissions, showing a peak in community engagement. This was a general round, welcoming projects from many categories, which also meant a heavier workload for the Citizens’ House.
After two quieter rounds (Rounds 5 and 6), Round 7 bounced back strongly with 567 (this data is as of July 2025) applications, coming close to the Round 3 peak. Early rounds like Round 1 (76 applications) and selective rounds like Round 5 (79 applications) saw lower participation, reflecting either the early-stage trust-building phase or a curated approach.
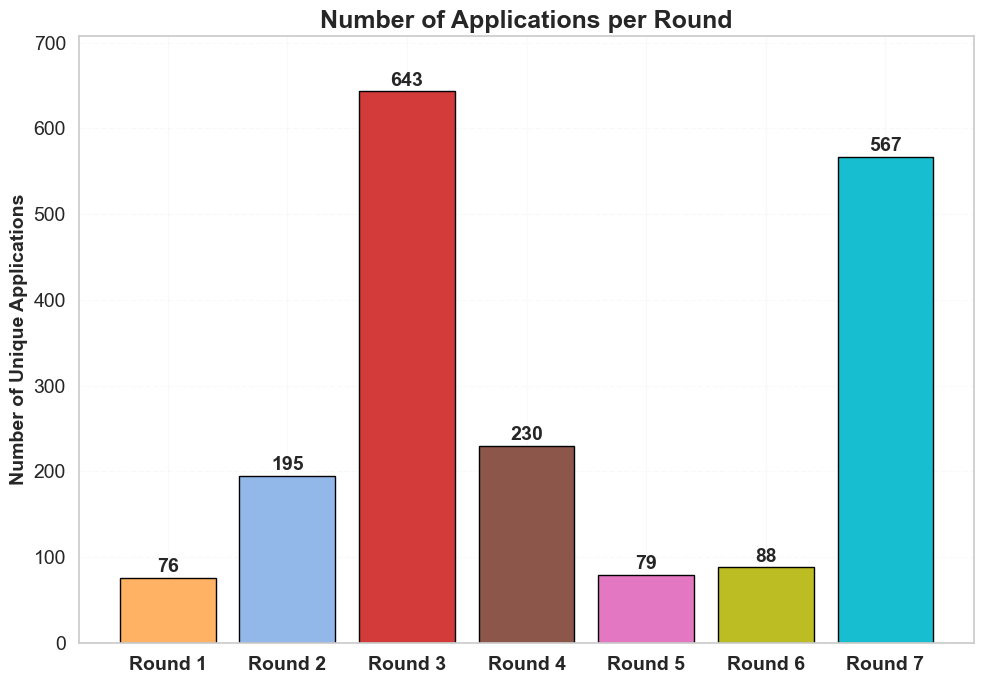
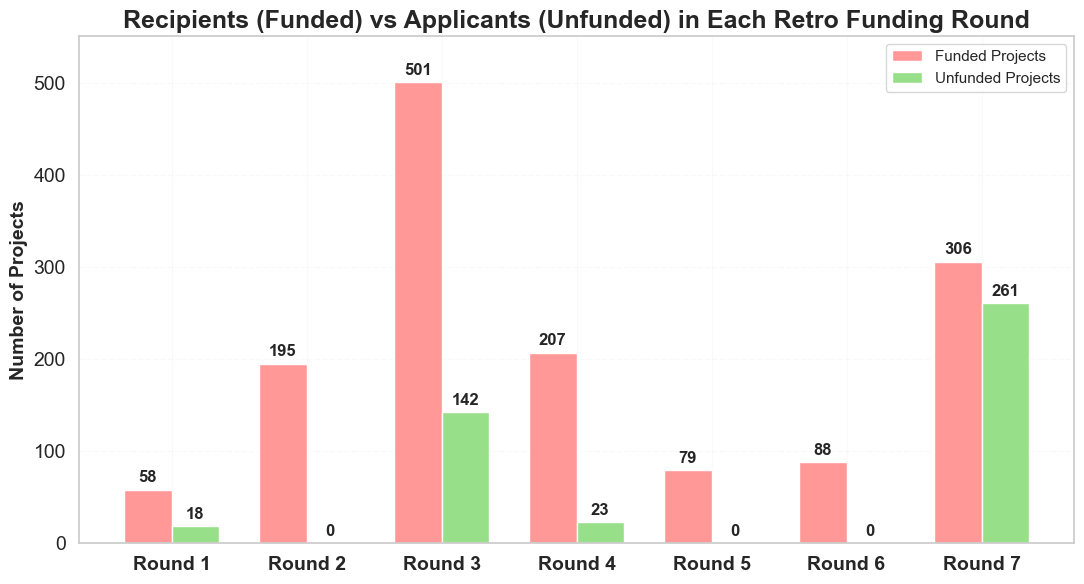
Unique, Funded, and Unfunded Projects
-
Rounds 2, 5, and 6 funded 100% of applicants, either due to a fully inclusive approach or pre-screened projects.
-
Round 7 had the highest number of unfunded projects (261), signaling more competition or limited resources.
-
Round 3 also had a significant unfunded portion (22%), showing the challenge of balancing large participation with meaningful allocations.
New vs Recurring Recipients
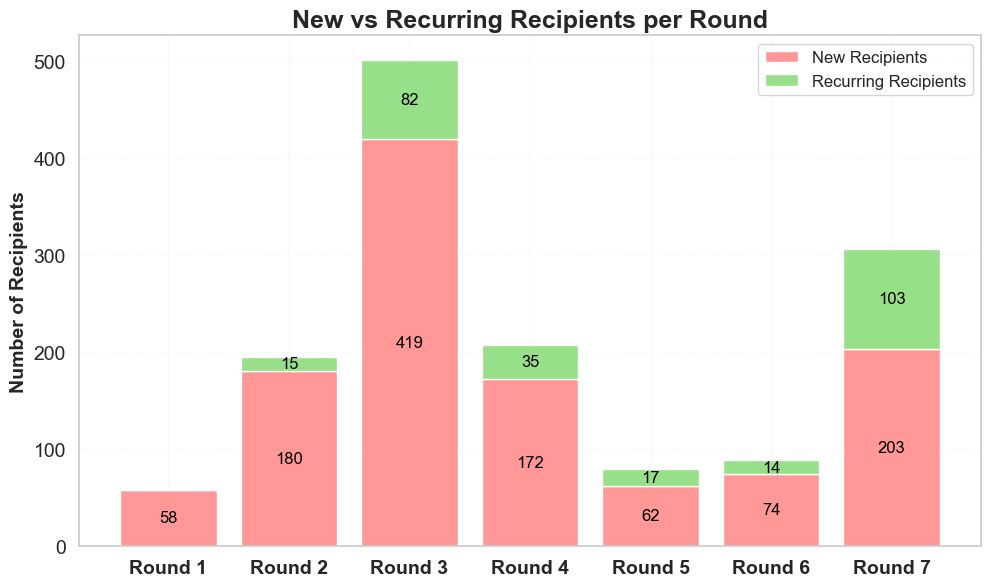
Every round welcomed new contributors, but recurring participation also grew steadily over time.
-
Round 3 had the largest influx of new projects (419 first-time recipients).
-
Recurring participants increased from 15 in Round 2 to 103 in Round 7, showing that many proven contributors continue to engage.
-
Round 7 struck a balance, with 203 new and 103 recurring projects receiving funding.
Participation Growth Over Time
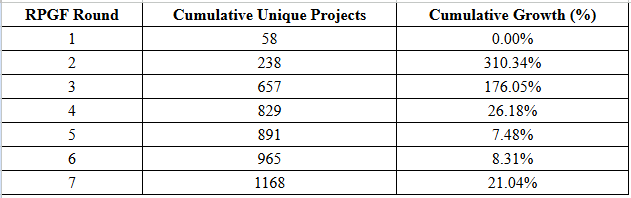
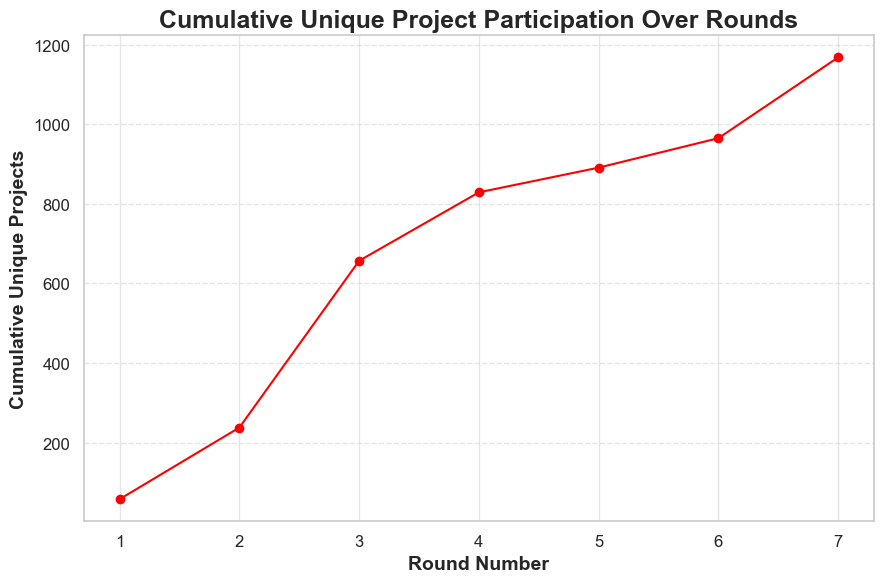
Growth in the early rounds was explosive, 310% in Round 2 and 176% in Round 3. After that, the pace slowed, but the trend stayed positive. By Round 7, the program had attracted 1,168 unique projects, showing consistent ecosystem expansion.
Projects Funded with Highest Rewards
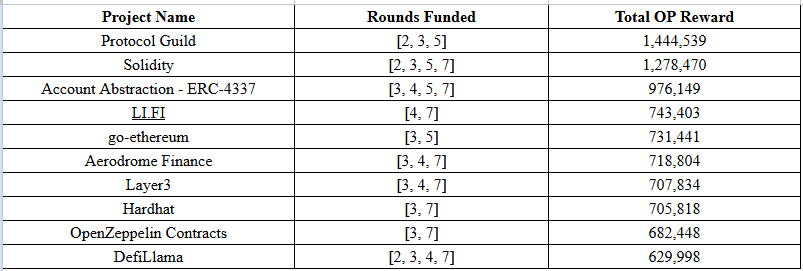
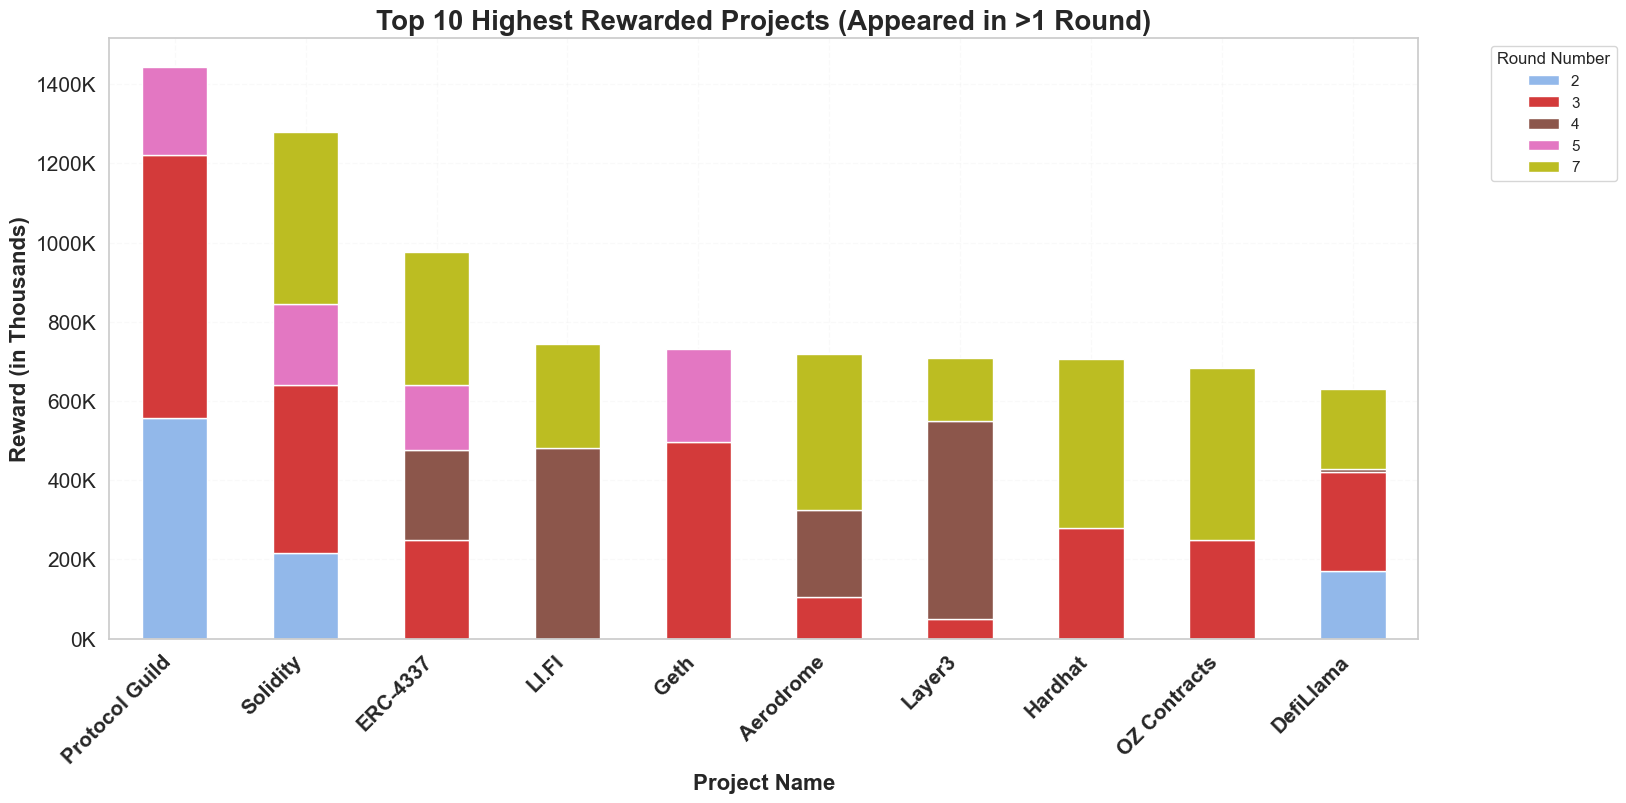
Some notable highlights:
-
Protocol Guild earned the highest total rewards (~1.44M OP) across three rounds, reflecting its central role in the ecosystem.
-
Solidity was funded in four different rounds, receiving over 1.27M OP, showing consistent recognition for critical infrastructure.
-
Account Abstraction – ERC-4337 followed with nearly 1M OP, reflecting growing importance in the community.
-
Other high-impact projects like LI.FI, go-ethereum, and Aerodrome Finance achieved substantial rewards despite fewer funded rounds.
-
Hardhat, OpenZeppelin Contracts, and DefiLlama underline the value placed on developer tools, security, and analytics.
Allocation & Distribution Analysis
Round-wise OP Distribution

The first RetroPGF round distributed $1M in USD instead of OP tokens, laying the foundation for future reward allocation. From Round 2 onwards, rewards were distributed entirely in OP.
Round 3 recorded the highest OP allocation with 30M OP, followed by Round 2 with 10M OP and Round 7 with 15.8M OP. The smallest allocation came in Round 6, with only 2.4M OP, showing a more selective or resource-constrained approach.
Rounds with higher allocations, like Round 3 and Round 7, generally rewarded a larger number of projects.
Statistical Summary (All Rounds)

Key Insights:
-
Round 3 – Highest overall distribution: ~30M OP to 501 projects, with a maximum reward of ~663.85K OP and a mean of ~59.88K OP.
-
Round 1 – Smallest scale: $1M split among 58 projects, with the lowest median ($14.67K) and minimum ($1.22K).
-
Round 5 – Highest average reward: ~101.27K OP, given to only 79 projects, indicating a selective funding approach.
-
Round 7 – Wide variation in rewards: mean of ~51.57K OP but a low median of ~13.99K OP, showing some very large grants skewing the distribution.
-
Round 6 – Most balanced allocation: mean and median close (~27.27K vs ~22.88K OP), reflecting equitable distribution.
-
Round 2 – Rapid participation growth after Round 1, but with wide differences in reward sizes.
-
Round 4 – Mixed approach, combining broad participation with a few very large grants.
Top Projects per Round
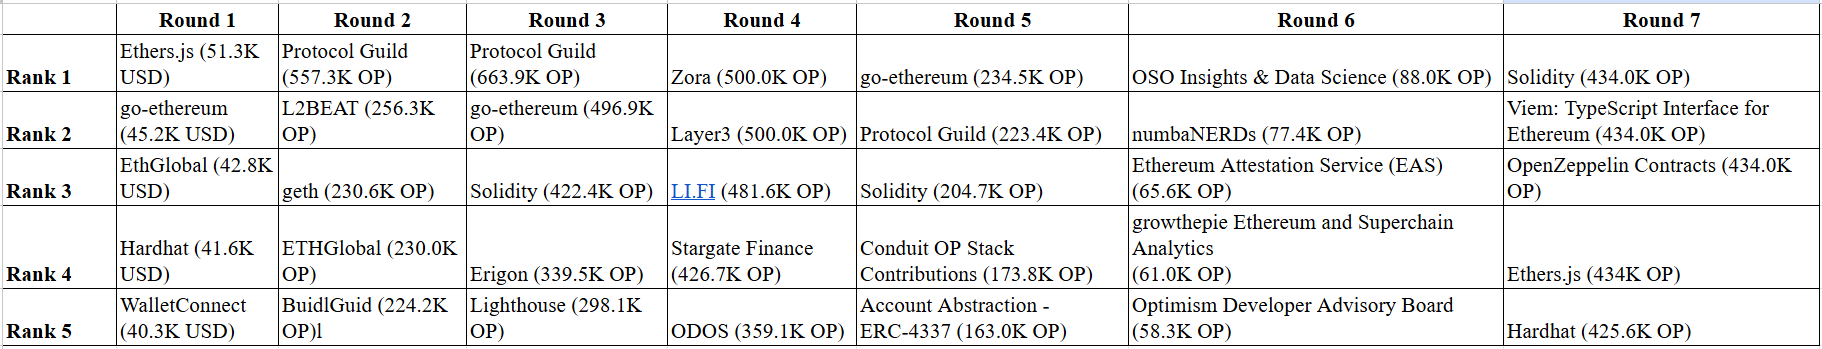
Round 1
Round 2
Round 3

Round 4

Round 5
Round 6
Round 7

Reward Distribution Insights
Analyzing the reward distribution across all RetroPGF rounds shows some clear trends in how the funds were shared and how fairly they reached the recipients. The data highlights how the approach has shifted over time, with some rounds focusing on balance while others leaned toward rewarding the biggest impact projects.
1. Skewness of Rewards
In every round, the average reward (mean) was higher than the middle value (median). This pattern is called a right-skewed distribution, and it means that while most projects received moderate amounts, a smaller number of projects got much larger rewards, which pulled the average up.
-
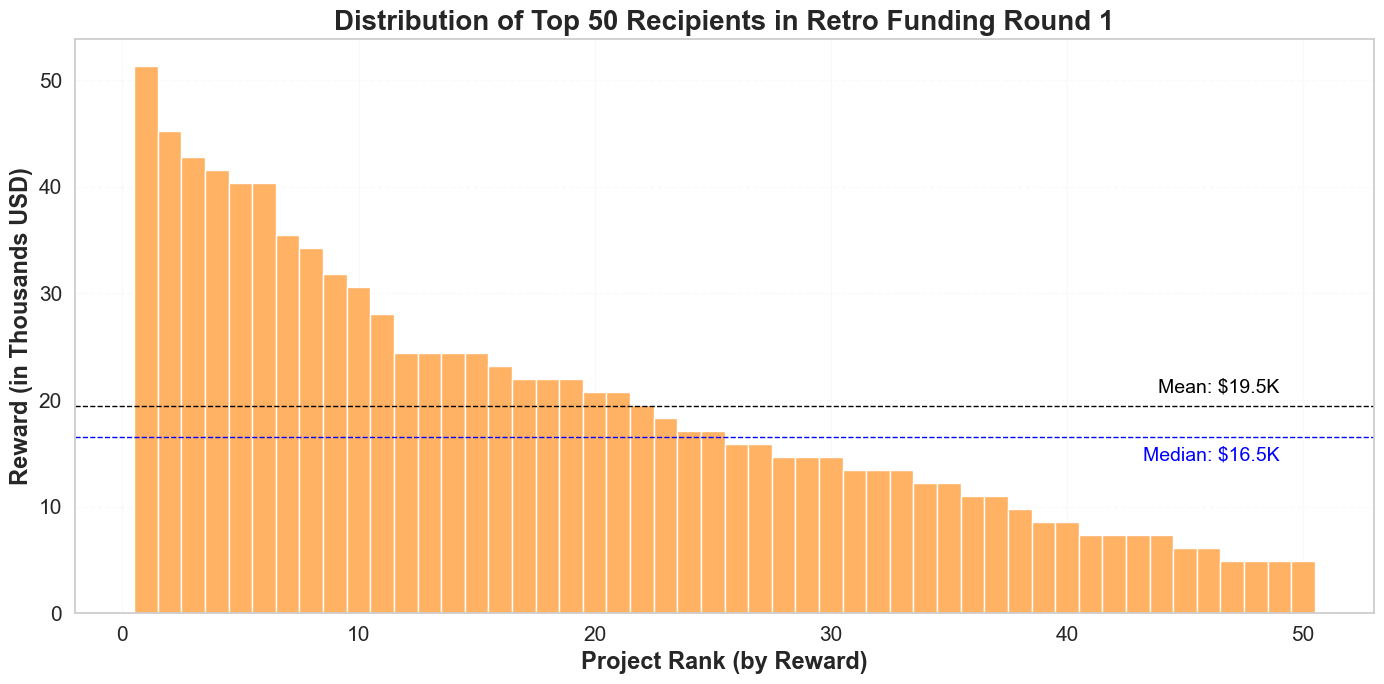
Round 1 – In the inaugural round of RetroPGF, a total of $1 million was allocated across 58 recipients, with a mean reward of $19.5K and a median of $16.5K. The relatively small gap between the mean and median highlights only moderate skewness, indicating a fairly balanced distribution of rewards at this early stage of the program.
-
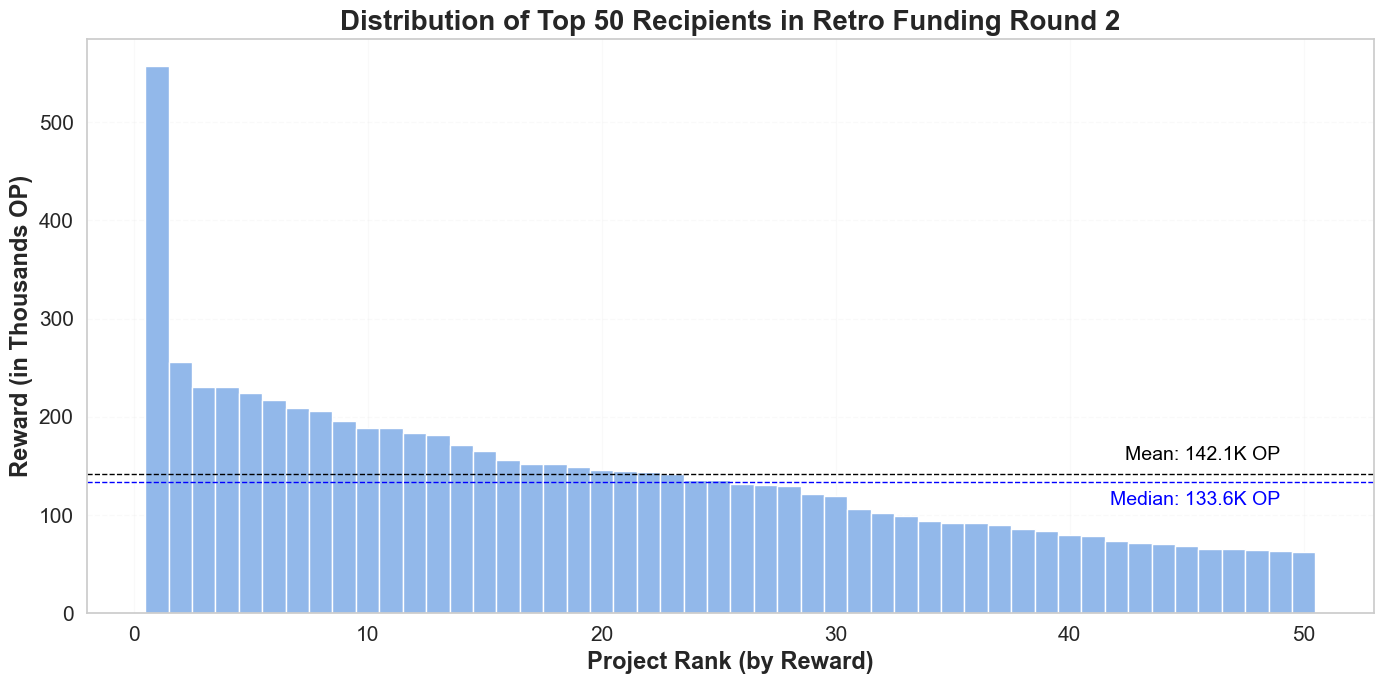
Rounds 2 – With an expanded pool of 10 million OP, 195 recipients received funding in Round 2. The mean reward was 142.1K OP, while the median was 133.6K OP, showing a modest increase in skewness compared to Round 1. This suggests the start of more varied reward allocations while still maintaining a reasonably equitable distribution.
-
Round 3 - significantly scaled the program with 30 million OP allocated across 501 recipients. The mean reward rose to 222.6K OP, with a median of 198.8K OP, revealing more pronounced skewness. Despite broad participation, a few top-performing projects received substantially larger rewards, reflecting growing differentiation in perceived impact.
-
Round 4 – With 10 million OP distributed among 207 recipients, the distribution in Round 4 exhibited even more skewness. The mean reward was 151.8K OP, while the median dropped to 112.6K OP. This widening gap suggests a shift toward allocating larger shares to standout projects, with a less balanced distribution than previous rounds.
-
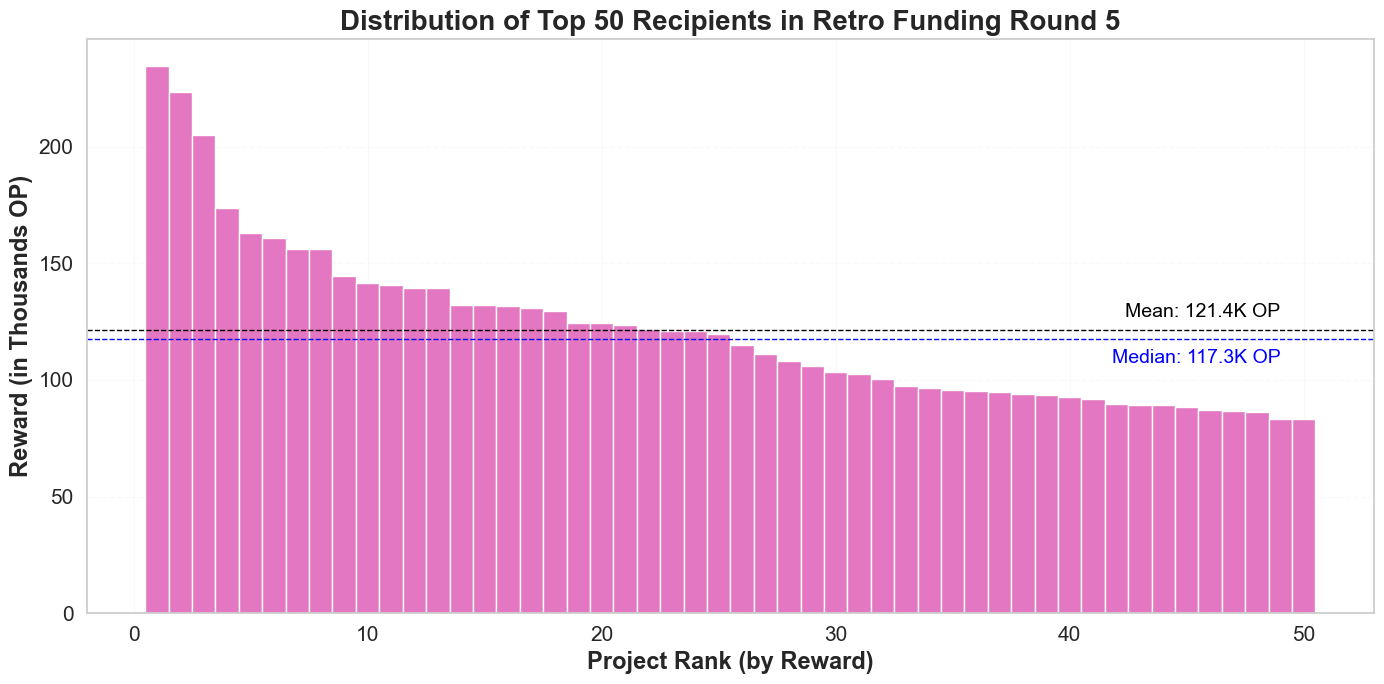
Round 5 – A total of 79 projects were funded in Round 5. The mean reward was 121.4K OP, and the median was 117.3K OP, showing a notably smaller difference between the two. This round marked a return to a more balanced reward strategy, with reduced skewness and a more even spread of funds across recipients.
-
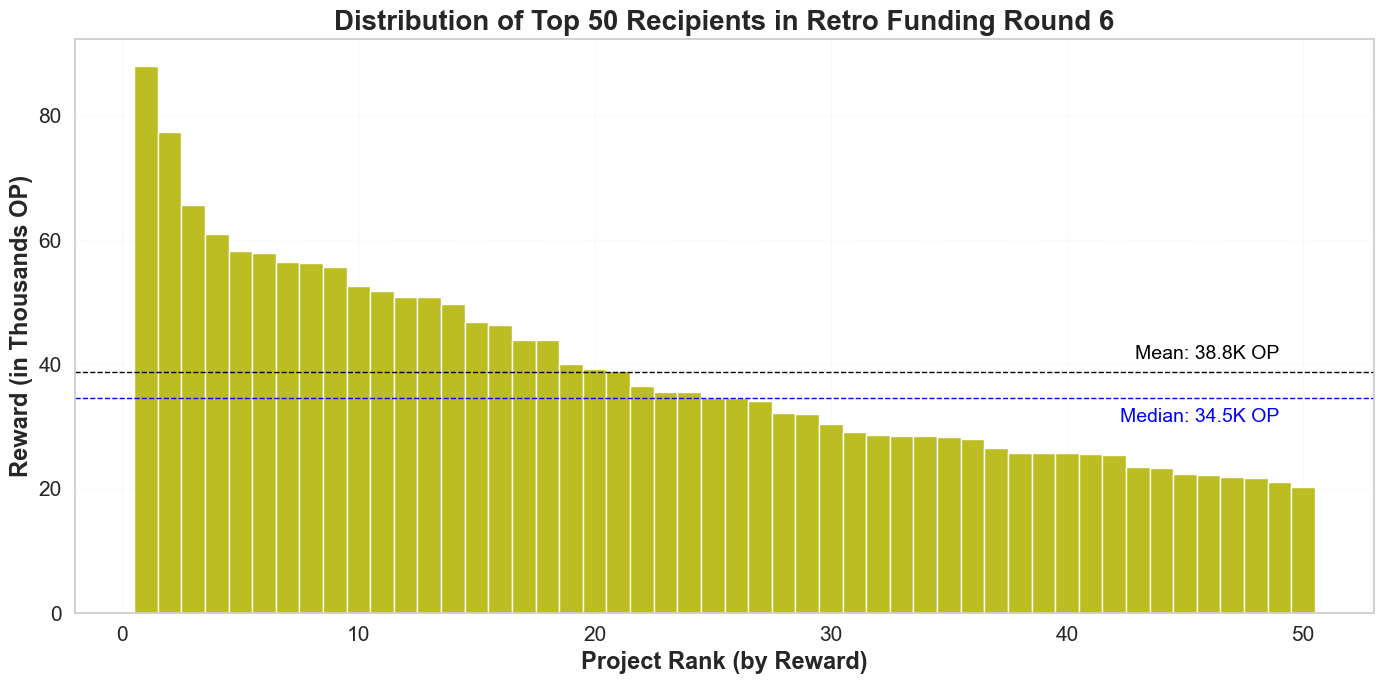
Round 6 – With a significantly reduced funding pool of 2.4 million OP, 88 projects received support. The mean reward was 38.8K OP, and the median was 34.5K OP, making this one of the most equitable rounds to date. The narrow gap between mean and median reflects a highly even distribution, likely due to constrained funds and deliberate allocation strategies.
-
Round 7 – The most recent round saw a substantial increase in the total pool, with 15.8 million OP distributed among 306 recipients. The mean reward was 216.4K OP, while the median was 181.9K OP, once again indicating significant skewness. Although many projects received substantial support, a few captured disproportionately high rewards, continuing the trend of favoring high-impact contributions in larger funding rounds.
2. Impact of Funding Size on Distribution
Larger funding rounds, especially Rounds 3 and 7, had higher mean values and more skewness. This reflects both the growing maturity of the ecosystem and a shift toward selectively rewarding standout contributions. In Round 7, the difference between mean and median was especially large, pointing to a higher concentration of rewards among top projects. In smaller rounds like Round 6, the smaller difference between mean and median suggests a more even and cautious reward allocation.
3. Evolving Distribution Strategies
Over time, the strategy has clearly evolved.
-
Early rounds leaned toward broader participation, with smaller gaps between mean and median.
-
Later rounds, especially Round 7, became more impact-focused, with fewer recipients getting a larger share of the total funds.
-
Some rounds, like Round 5, still showed attempts to reduce excessive concentration, but the latest data suggests a renewed focus on rewarding outsized impact.
Data Sources
Findings are based on publicly available data from: